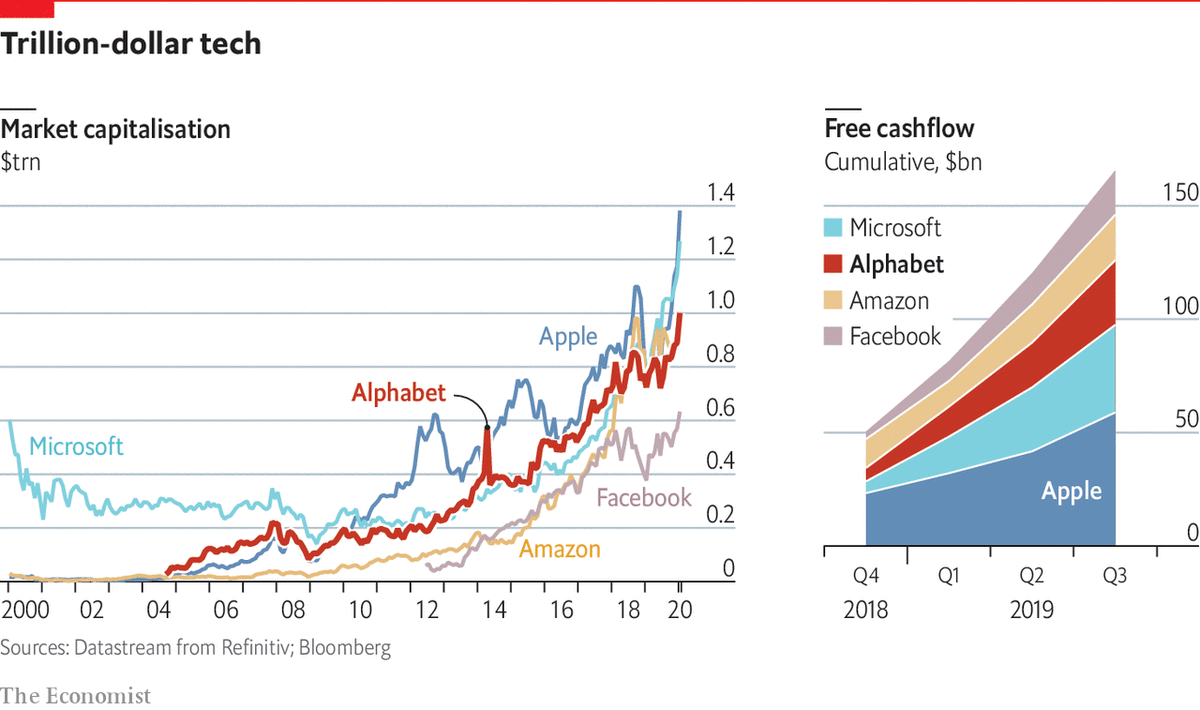
The trillion dollar club.

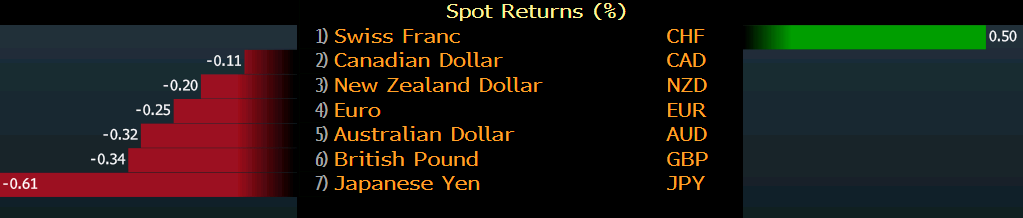
 The dollar has generally made some gains this week against various currencies. These movements came after fairly good data from the USA as well as the signing of a first stage trade deal between the USA and China.
Some of the biggest news in forex markets this week came from central banks. Both the South African Reserve Bank (SARB) and the Central Bank of the Republic of Turkey (CBRT) cut rates against expectations. The CBRT was first yesterday morning, cutting its one-week
repo rate from 12% to 11.25% compared with the consensus expectation of 11.5%.
Then the SARB also cut its repurchase rate to 6.25% yesterday afternoon, another decision that defied expectations. In a rare display of agreement among central bankers, the SARB’s
monetary policy committee voted unanimously to cut by 0.25%.
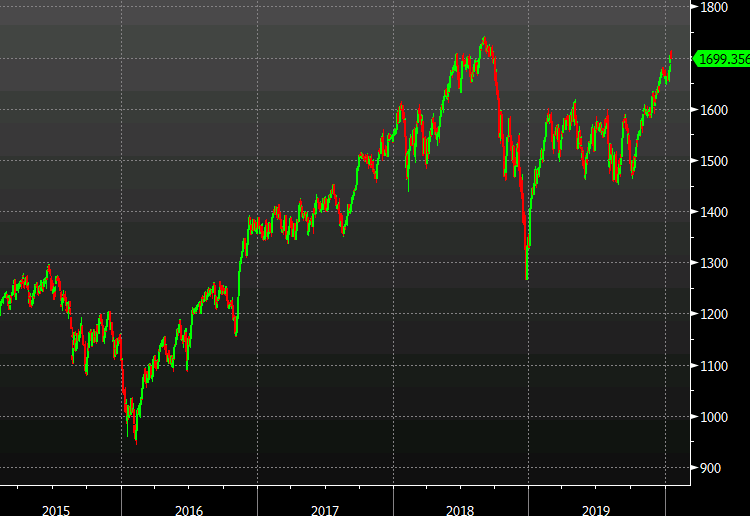
Shares reacted eagerly to news of the preliminary Sino-American trade deal, with US500 continuing its rapid gains since Monday’s open. Many European indices and shares also reached new all-time highs.
Bitcoin-dollar, daily
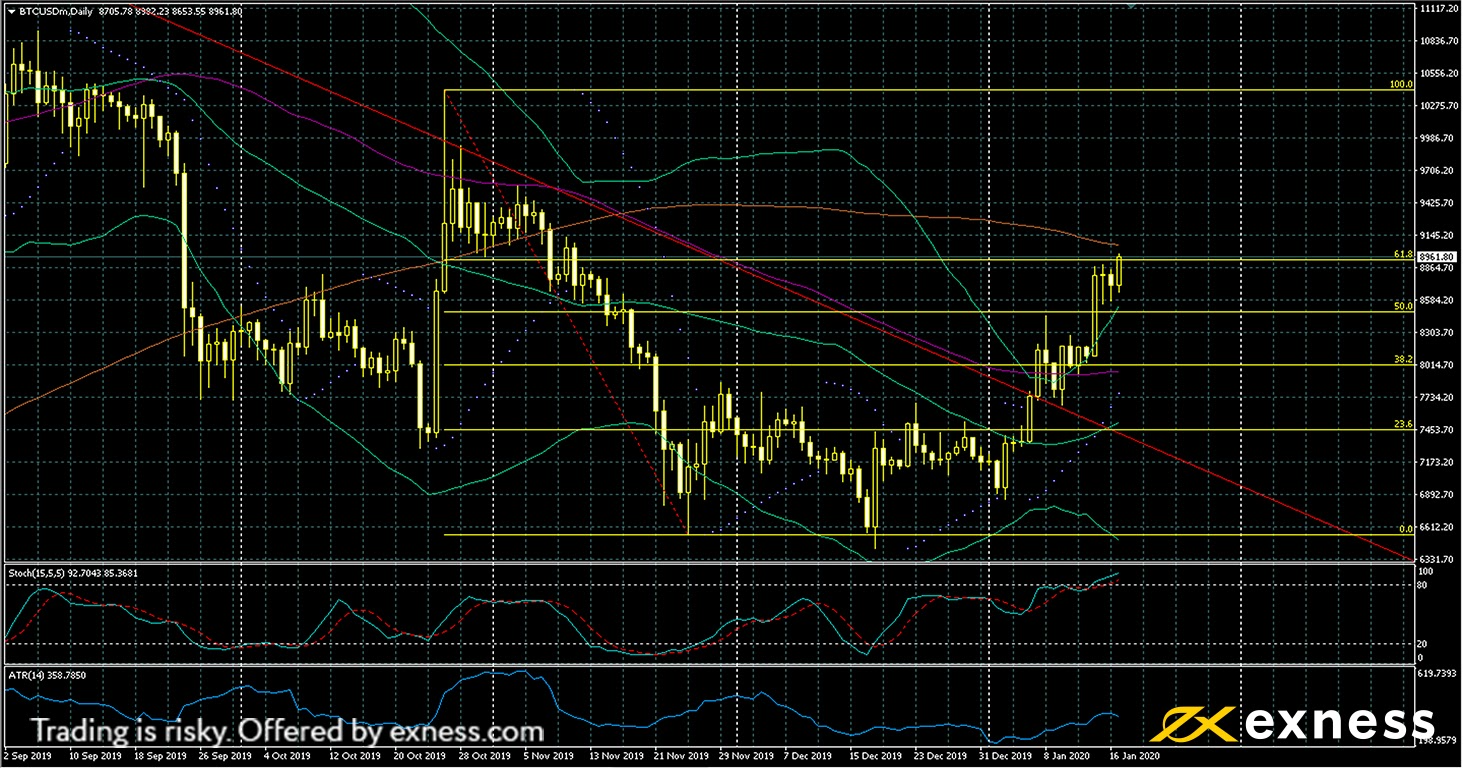 BTC-USD has surged up even more in the second half of the week. Current levels around $8,900 are the highest for about two months. The red trendline here is based on the weekly chart, starting from last summer’s highs around $13,000.
We can clearly see that price has broken out upward from this trendline, facing little resistance from the 100-period simple moving average.
The first major hurdle for the bulls here is likely to be the 200-day moving average. This is expected to be a strong area that could well resist testing at least temporarily. The 61.8% Fibonacci retracement area which price is currently testing could also function as a resistance.
Technical indicators here give a very strong overbought signal. Price closed the last three days completely outside the upper deviation of Bollinger Bands (50, 0, 2).
The slow stochastic (15, 5, 5) is also clearly within the upper trigger zone. These factors would suggest that a retracement to some degree is likely within the next few periods.
American light oil, four-hour
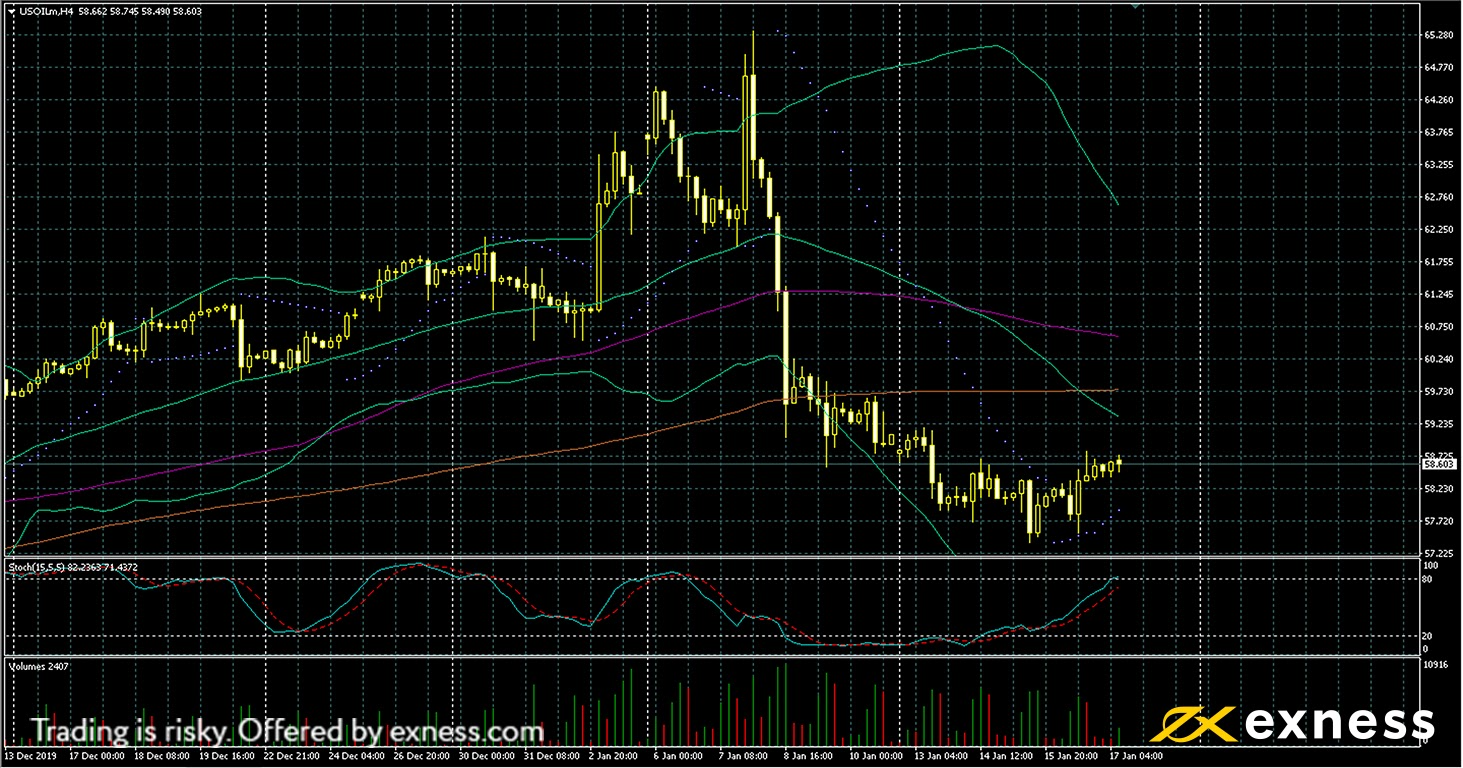
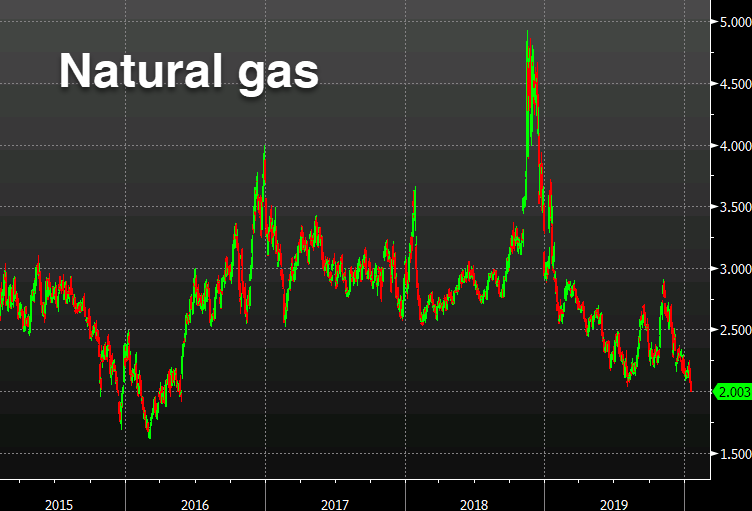
USOIL’scorrection appears to have paused for now. The large losses from last week’s nine-month highs were driven mainly by the decline of military tension between the USA and Iran in Iraq. Now, though, the signing of the first stage deal between China and the USA has given crude a significant fundamental boost.
As China is the world’s biggest consumer of crude oil, the outlook for the Chinese economy often influences the price of the commodity.
The regular data for crude were somewhat incompatible this week. The API’s stock change announced a gain of 1.1 barrels per million, but the EIA’s stock change read negative 2.55 million on Wednesday night.
USOIL didn’t react very strongly to either release, so we might expect that trade and Chinese data could continue as key drivers next week as well.
From a technical standpoint, the conditions seem to be there for oil to continue its overall uptrend from Q4 2019. Momentum to the downside has dried up this week while buying volume remains fairly high.
The most important resistances in the short term are likely to be the three moving averages, with the 200-period SMA probably the most important of these.
Dollar-yen, four-hour
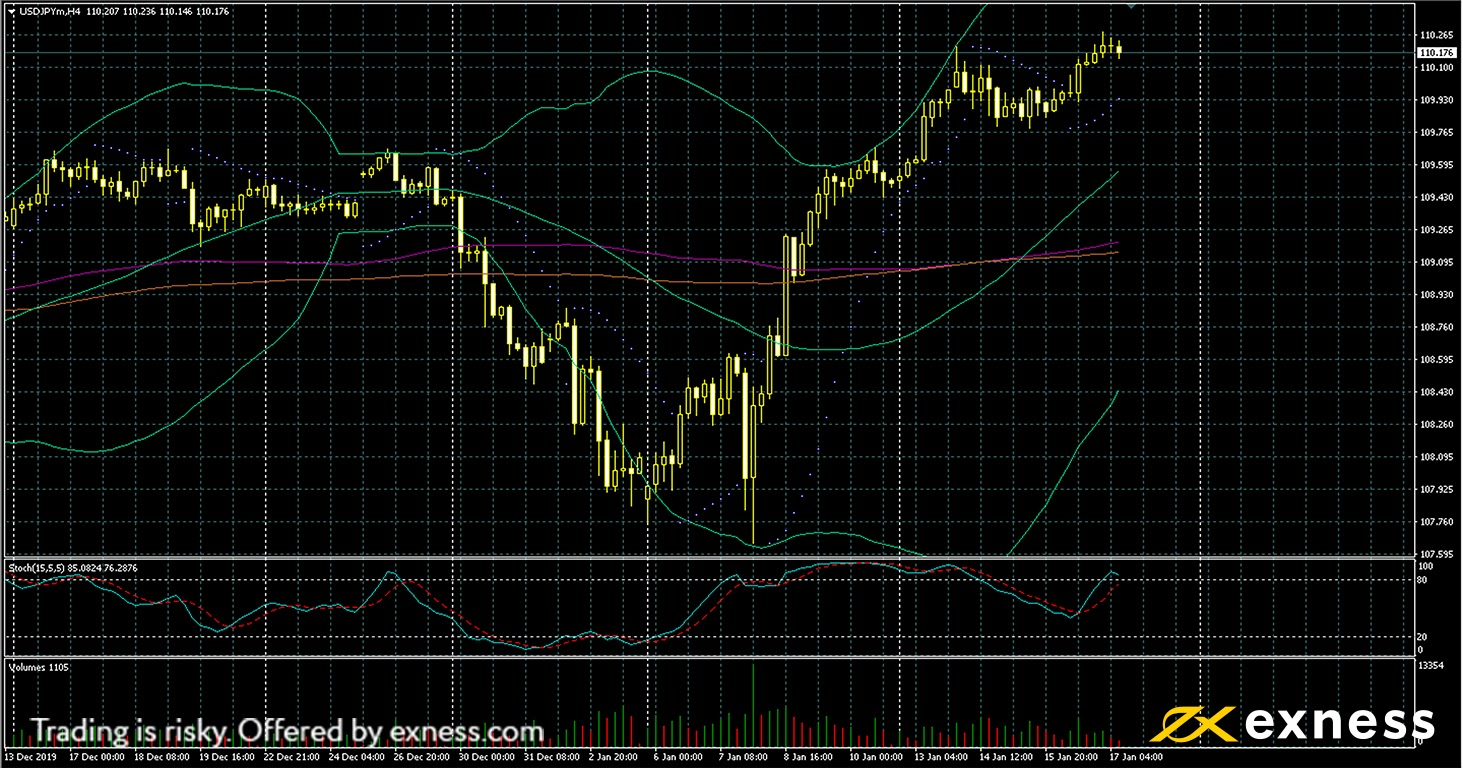
USD-JPY has been somewhat less volatile this week while continuing to make some gains overall in the aftermath of decent data from the USA. Annual inflation and core inflation on Tuesday both printed 2.3% in line with expectations, the former beating the previous figure by 0.2%.
American retail sales came in at 0.3% yesterday afternoon in line with the consensus, but November’s release was revised upward slightly.
The charts look positive for dollar-yen but buying saturation could limit any ongoing gains. Price remains above all three of the usual moving averages, with the faster 50 SMA completing a golden cross of the slower two on Wednesday afternoon GMT.
On the other hand, volume remains very low, and the slow stochastic is still slightly inside the overbought zone.
It seems that most traders are waiting for key releases next week to provide some momentum, up or down. The Bank of Japan’s meeting on Tuesday morning and Japanese inflation late on Thursday evening are expected to bring some more direction to USD-JPY.