rss

CFTC Commitments of Traders: Pound shorts haven’t been squeezed…yet

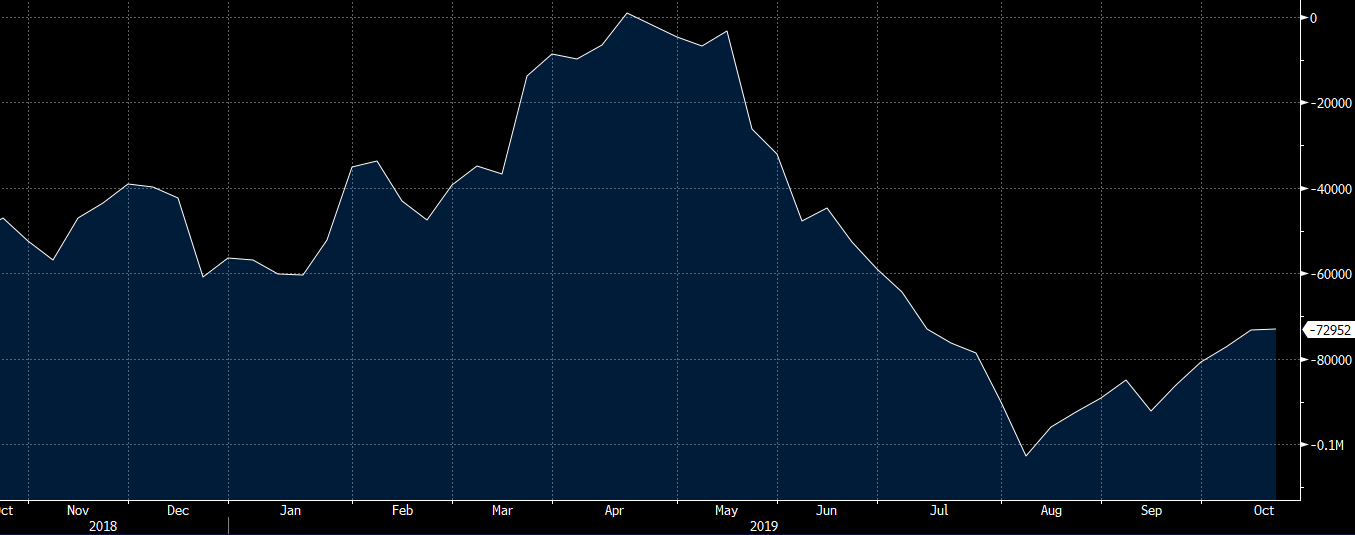
Forex futures positioning data from the CFTC for the week ending October 15, 2019:

Forex futures positioning data from the CFTC for the week ending October 15, 2019:
  • EUR short 75K vs 75K short last week. Unchanged
  • GBP short 73K vs 73K short last week. Unchanged
  • JPY short 7K vs 11K long last week. Longs switch to shorts in an 18K drop
  • CHF short 13k vs 11k short last week. Shorts trimmed by 1K
  • AUD short 48k vs 46k short last week. Shorts increased by 2K
  • NZD short 40K vs 38K short last week. Shorts increased by 2K
  • CAD long 13K vs 5K long last week.  Longs trimmed by 1K
  • Prior week

The big moves in sterling came last week and I’m surprised there wasn’t any covering through Tuesday. That’s good news if you’re long GBP because it leaves lots of juice to squeeze.

US SEC charges 18 traders in a manipulation scheme … profits over $31 million

The US Securities and Exchange Commission has obtained an asset freeze against the 18 traders

  • scheme to manipulate more than 3,000 U.S.-listed securities
  • for over $31 million in illegal profits
The SEC alleges that the traders, who are primarily based in China, manipulated the prices of thousands of thinly traded securities by creating the false appearance of trading interest and activity in those stocks, thereby enabling them to reap illicit profits by artificially boosting or depressing stock prices. 
For example, according to the SEC’s complaint, the traders used multiple accounts to place several small sell orders to drive down a stock’s price before using a different set of accounts to buy larger amounts of the stock at the artificially low prices. After accumulating their position, the traders then flipped the script and placed several small buy orders to push up prices so they could then sell their stock at artificially high prices.

USD up trend is 99 months old soon. Is it over? No, another 12-24 months still to come

The headline is the in summary version of a client note from UBS on the US dollar.

Its a detailed look at the US dollar trend, but adding to the to the headline points in brief.
When and how the dollar might turn is anyone’s guess
  • longterm dollar trend …  As of last month, it was still levying upward pressure … did not appear to be waning materially
  • medium term trend  …  duration of 2-5 years … more or less mirrors intra business cycle growth surges and slowdowns
  • shorter term one that averages about a year…. seems to relate to shocks caused by politics and supply disruptions to commodities … a modest dollar drag today … could reflect the … trade war coming home to roost and the drag on Chinese leading indicators passing, as fiscal stimulus from tax cuts and modest credit easing have begun to filter through

Will China GDP matter more to assets than any US-China deal?

Via Bloomberg

China
The title of this post was a good question on Bloomberg’s Markets live blog at the end of last week. Mark Cranfield phrased the question as follows:

China’s 3Q GDP is due Oct 18 and it could be the first time on record that it prints below 6%. That could have a greater long-term impact on assets than a partial trade deal. Especially, as Bloomberg Economics expect policy makers to step up stimulus in response to stabilise the mainland economy.

If so, will that make China equities an asset class that become less correlated to the direction of Wall Street and global stocks? Would it trigger an asset swicth away from China bonds that spills over to other fixed income markets?

My assessment is that Firstly.  China’s GDP growth is going to be slowing due to reasons of growth. It is not the norm for developed countries to have double digit growth in the GDP. As China joins those developed nations it is only normal that GDP slows in pace.
Secondly, on a more general note, I think that the US-China deal matters more than the GDP figures. No deal – bad GDP would have been the worst outcome. With the US and China together making up 40% of the world’s GDP and the US on it own about 25% a good deal between those two countries should ultimately put positivity back into asset classes. It feels like the disaster outcome has avoided for now.
What is your take on it?

How Isaac Newton went flat broke chasing a stock bubble

For practitioners of Schadenfreude, seeing high-profile investors losing their shirts is always amusing.

But for the true connoisseur, the finest expression of the art comes when a high-profile investor identifies a bubble, perhaps even makes money out of it, exits in time – and then gets sucked back in only to lose everything in the resultant bust.

An early example is the case of Sir Isaac Newton and the South Sea Company, which was established in the early 18th Century and granted a monopoly on trade in the South Seas in exchange for assuming England’s war debt.

Investors warmed to the appeal of this monopoly and the company’s shares began their rise.

Britain’s most celebrated scientist was not immune to the monetary charms of the South Sea Company, and in early 1720 he profited handsomely from his stake. Having cashed in his chips, he then watched with some perturbation as stock in the company continued to rise.

In the words of Lord Overstone, no warning on earth can save people determined to grow suddenly rich.

Newton went on to repurchase a good deal more South Sea Company shares at more than three times the price of his original stake, and then proceeded to lose £20,000 (which, in 1720, amounted to almost all his life savings).

This prompted him to add, allegedly, that “I can calculate the movement of stars, but not the madness of men.”

South Sea Company (more…)

The bond market isn’t feeling too upbeat on trade talks

Treasury yields fall across the curve to session lows

USGG10YR

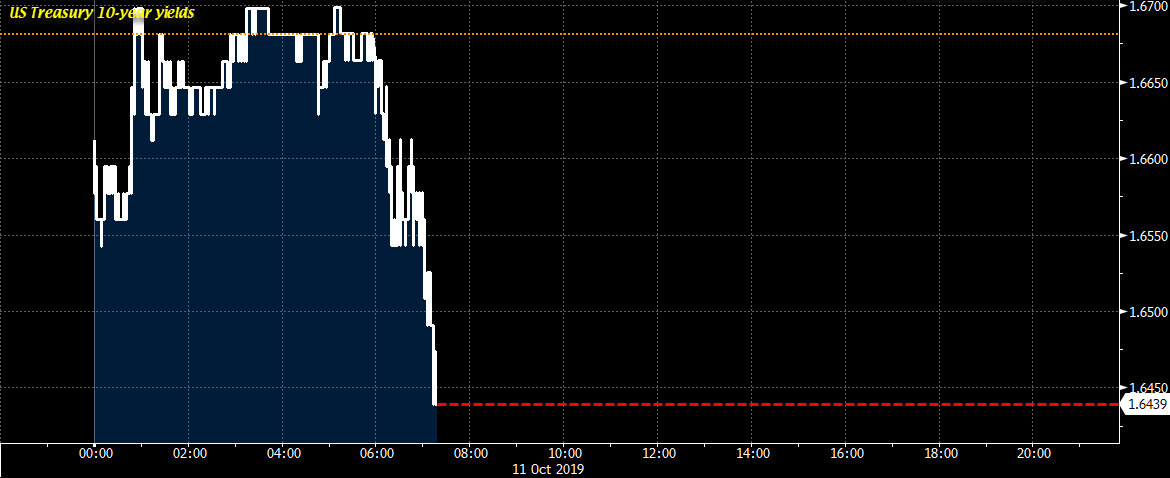
10-year yields are down by 2.5 bps to 1.644% as yields slip across the curve to start the European morning. While equities are holding higher, the bond market is sending a different signal with regards to positioning ahead of the trade talks outcome.
Essentially, this is what is holding yen pairs back from moving higher on the day with USD/JPY still seen near flat levels at 108.00.
Markets are mixed and a bit paralysed at the moment as everyone is just waiting to see what happens to talks in Washington later today. I reckon that will remain the case ahead of North American trading before we get more trade headlines to work with.

Here is what a US-China ‘currency pact’ would mean for the dollar and the yuan

Morgan Stanley (this via Bloomberg) say a pact is likely to weaken the USD and strengthen the Chinese yuan.

Well, yeah.
More:
  • could lead to broad based USD weakness, especially benefitting China-proxy currencies
  • yield curves would get steeper
  • yen would weaken
MS say it’d be a ‘Plaza Accord’ lite.
A bit of a summary if its of interest.

US auctions off 30 year bond at 2.170% vs WI level of 2.169%

US auctions off $16 billion of 30 year bonds

  • High yield 2.17% versus WI of 2.169%
  • Bid to cover 2.25x vs six-month average of 2.23x
  • Dealers took 22.94%. vs six-month average of 27.3%
  • Directs 18.5% vs six-month average of 18.8%
  • Indirects 58.5% vs six-month average of 67.2%
the US treasury completed its refunding by selling 16 billion of 30 year bonds at a high yield of 2.17%. That was slightly above the 2.169% level at the auction time. The bid to cover was near the six-month average. Dealers took a lower percentage than the average at 22.94% suggesting a distribution of the auction to nondealer participants.
Give the auction the C+ to B-

Order flow levels across major pairs.

Orders in the market seen across major pairs

  • Sell orders on NZDUSD on 0.6480/90 and 0.6360/70
  • Sell orders on AUDUSD at 0.6800/10 and 0.6910/20
  • Sell orders on EURJPY at 120.40/50, 118.70/80

and buy orders at 116.20/10

  • Sell orders on USDJPY at 108.70/80, 108.30/40

and buy orders at  106.00/90 and 105.00/90

Sell orders on GBPUSD at 1.2680/90 and 1.2530/40

and buy orders at 1.2000/90

  • Sell orders  on EURUSD at 1.1010/20

Ahead of the FOMC minutes this week, a forecast of an October rate cut

UBS are citing the US slowdown to potentially arrive sooner than expected

  • Which, they say, opens the door to a Fed funds rate cut in October.
(Federal Open Market Committee meeting is October 29 and 30)
Citing trade tension with China –  a substantial shock to the economy – tariffs causing a slump in private demand
  • tarfifs weakening employment in manufacturing, retail
Following that the bank expects further cuts in:
  • January, March and June 2020
  • And also say that due to the run of recent data there is risk is to the downside for the Fed to cut more.
Go to top