rss

China May CPI 1.3% y/y (vs. expected 1.6%) and PPI 9.0% y/y (vs. expected 8.5%)

Inflation data from China for May 2021

CPI 1.3% y/y

  • expected 1.6% y/y, prior 0.9%
  • food prices expected to fall, pork prices continue to plunge
  • for the month/month -0.2%

PPI 9.0% y/y, higher than the median estimate and fastest since 2008

  • expected 8.5%, prior 6.8%
  • impacted by rising commodity prices
  • for the m/m, +1.6%

Consumer-level inflation down a little but producer level inflation up very quickly indeed. PPI not flowing through to CPI this month at least though.

Oil data indicated the 3rd consecutive week of US stocks drawdown. Add in these 2 other price-supports also.

Comments on oil via ANZ, pointing to expectations of stronger demand.

ANZ reasoning this is due to accelerating vaccinations and easing travel restrictions.
  • Recent traffic data suggests travellers are hitting the roads as restrictions ease. Traffic congestion in 15 European cities is at its highest since the pandemic began, according to TomTom data. The boost to demand is expected to be strong. 
And, on the supply side:
  • This is backed up by signs of tightness in the physical market. The Middle Eastern Dubai benchmark is trading at its steepest backwardation in almost a year. 
Comments on oil via ANZ, pointing to expectations of stronger demand. 

Here’s a restrained view on the Chinese yuan – more two-way trading, not a sharp downtrend

HSBC with a restrained view for RMB, looking for its appreciation to slow and prompt some range trading, not a sharp reversal.

  • We believe the recent comments and countercyclical measures out of China … suggest that, while there is no line in the sand, there is still a policy preference for basic stability of the RMB exchange rate.
  • We do not believe the recent downward momentum is the beginning of a long-term RMB appreciation trend. Cyclical indicators are pointing to a likely slowdown of GDP growth and smaller yield advantage for China in 2H21. We expect these cyclical developments to see net FX flows to China moderating in 2H21.
  • Broad USD weakness may be tested, if the Federal Reserve’s tapering debate picks up later in the year and some of the generous USD liquidity conditions could subside later this year. Our economists expect an official tapering announcement at the end of the year and implementation in 2022.
  • We think that China’s broad FX framework has not changed, namely two-way capital account liberalisation is maintained with the aim of achieving a balanced flow. Our base case sees USD/RMB exhibiting more two-way movement and then rise slightly later this year, when China’s outbound investment liberalisation accelerates, likely in 2H21.
(I bolded those Fed comments from HSBC that were part of the yuan note).
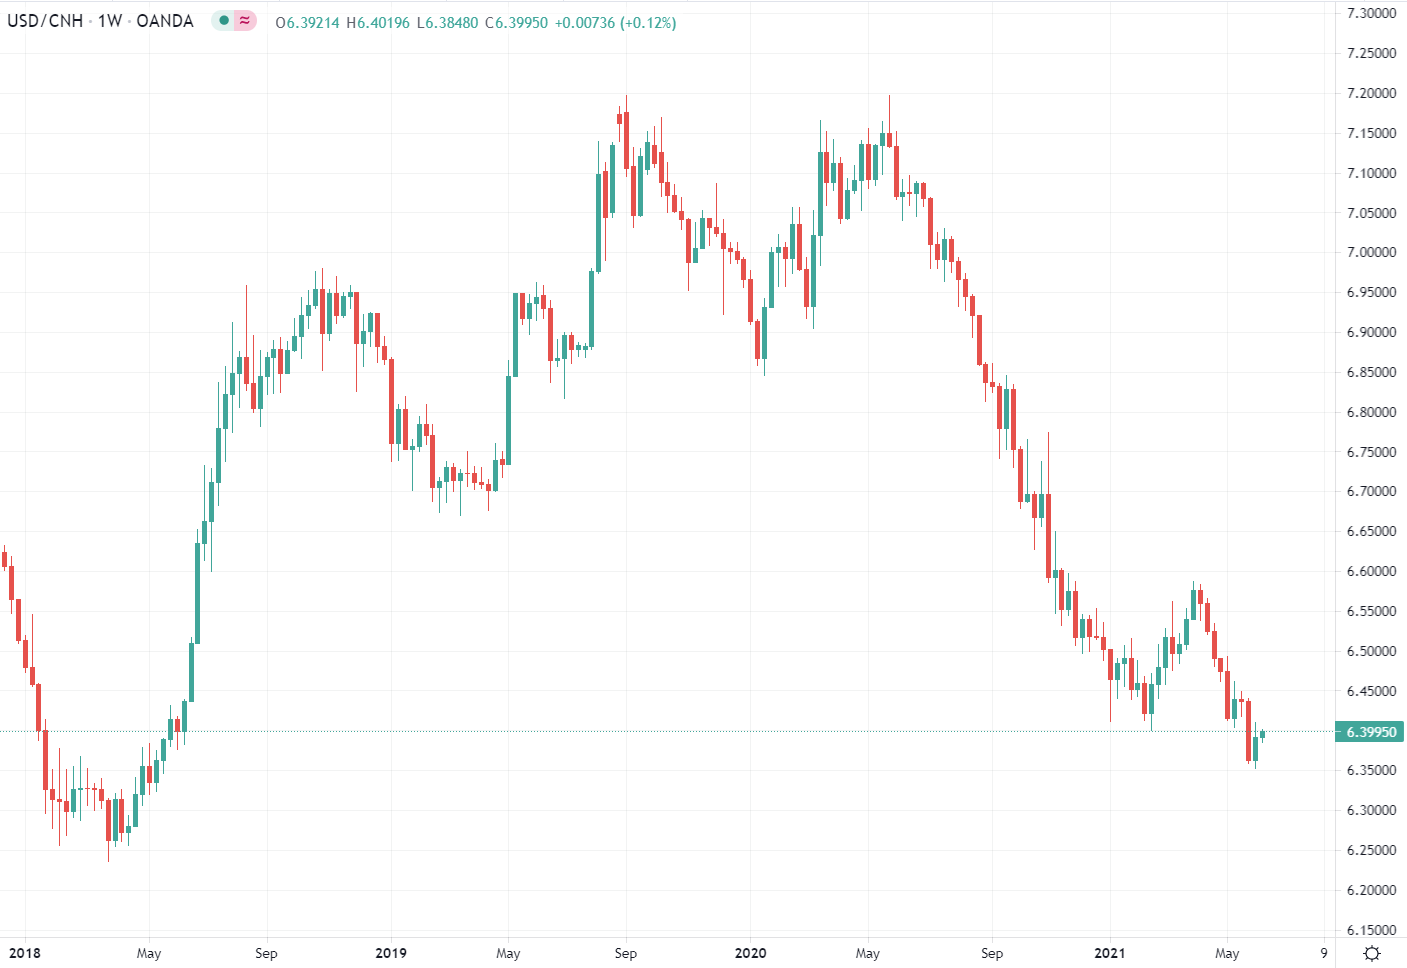
Weekly offshore yuan (USD/CNH) candles showing the appreciation trend for yuan  since the middle of last year.
HSBC RMB usd.cnh yuan

US Indices end the session mixed. Dow down. S&P unchanged. Nasdaq up

NASDAQ closes at the highest level since April 30

The major indices close mixed with the S&P unchanged. The NASDAQ index higher. The Dow industrial average lower.

  • S&P close just below record closing level of 4232.60
  • NASDAQ closes at highest level since April 30
  • Energy sector was the biggest gain or help by WTI crude oil which closed up one dollar and above $70 for the first time since October 2018
  • Real estate and energy sectors closed at record levels
  • NASDAQ post three day win streak
The final numbers are showing:
  • S&P index rose 0.70 points or 0.02% at 4227.22
  • NASDAQ index close up 43.19 points or +0.31% at 13924.91
  • Dow felt -30.42 points or -0.09% at 34599.82.
For the Russell index it led the way to the upside with a gain of 24.58 points or 1.06% at 2343.76.
Go to top