rss

This is what gold fever looks like

Hungry for gold news?

Hungry for gold news?  
Last week I made one comment that submitted to one media outlet on gold prices. The take up was telling.
The below was the amount of publications it occurred in and the approximate circulation.
Remember the below came from just one comment.
This is what a mania market looks like.
Gold is buy on the dips and buy on the breakouts. If you could only trade one market this year – this would be it. 

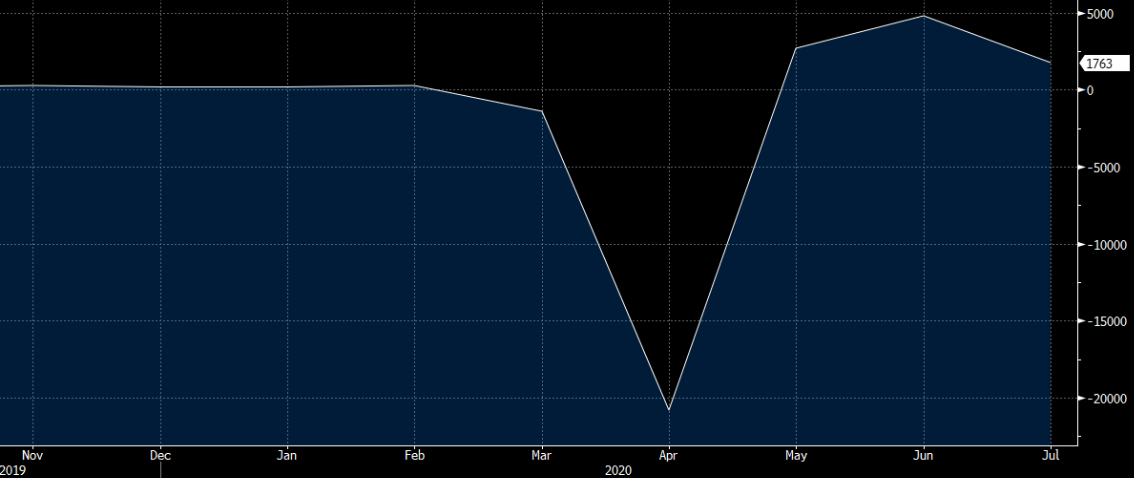
US July non-farm payrolls +1763K vs +1480K expected

US July 2020 non-farm payrolls data

nonfarm payrolls chart
  • Prior was +4800K (revised to 4791K)
  • Two month net revision +17K
  • Change in private payrolls +1462K vs +1200K expected
  • Change in manufacturing payrolls +26K vs +255K expected
  • Unemployment rate 10.2% vs 10.6% expected
  • Adjusted for misclassification 11.1%
  • Prior unemployment rate 11.1%
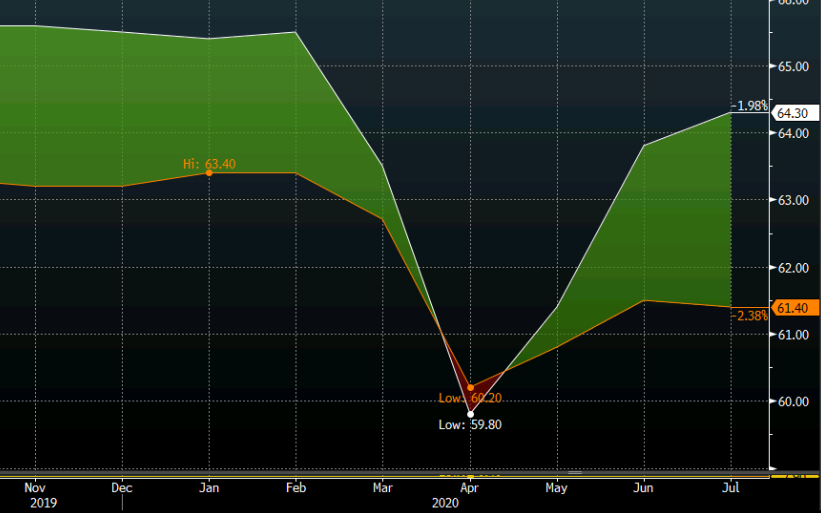
  • Participation rate 61.4% vs 61.8% expected
  • Prior participation rate 61.5%
  • Underemployment rate 16.5% vs 18.0% prior
  • Average hourly earnings +0.2% m/m vs -0.5% expected
  • Average hourly earnings +4.8%% y/y vs +4.2% expected
  • Average weekly hours 34.5 vs 34.4 expected
  • Employment in the household survey +1.4m
  • Part time jobs +803K
  • Full time jobs little changed
  • Full report
I noted before the report that a seasonal adjustment quirk was likely to add nearly 1m jobs to payrolls. It only added 245K jobs. From the BLS:
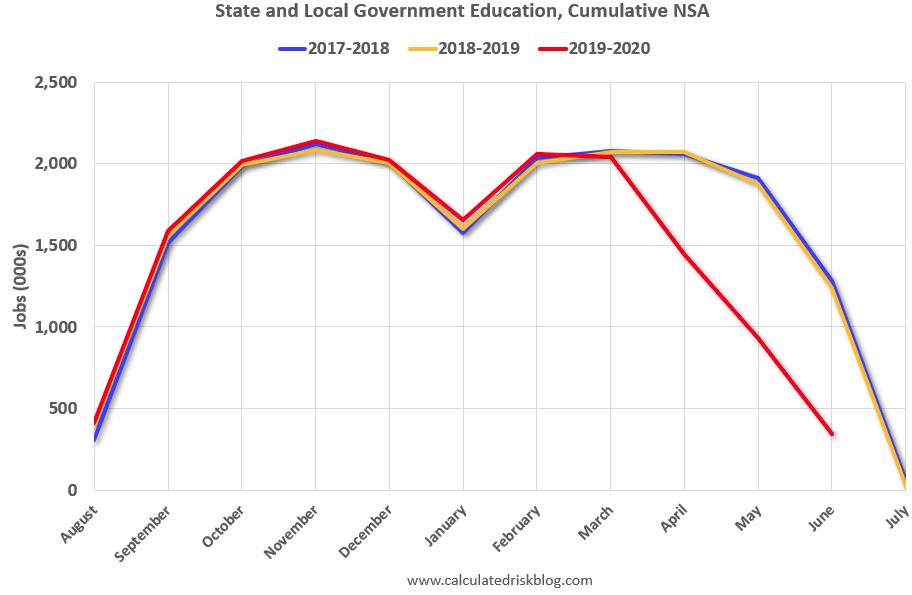
Government employment rose by 301,000 in July but is 1.1 million below its February level. Typically, public-sector education employment declines in July (before seasonal adjustment). However, employment declines occurred earlier than usual this year due to the pandemic, resulting in unusually large July increases in local government education (+215,000) and state government education (+30,000) after seasonal adjustment.
However it was even stronger than that and the majority of it was in private payrolls. The unemployment rate was also better but you can discount most of that because of a dip in participation rather than the rise expected.
Looking at the US and Canadian jobs data together, one thing that caught my attention is the growing gap in labor force participation. The Canadian participation rate now 1.2 pp below Feb levels while US 1.9 pp lower. I would have expected it the other way around with more of Canada shut in July. That will be something to watch in the months ahead.
US vs Canada participation rate

Non-farm payrolls preview: Half the expected jobs gain in July are because of a quirk in seasonal adjustments

Teaching jobs are a big quirk

The consensus for Friday’s non-farm payrolls report is for 1.5 million jobs gains in the month but that doesn’t tell the real story.
The ADP report this week got some attention because it showed private hiring at just 167,000 jobs. Normally, you would expect that to take a big bite out of expectations, but it hasn’t.
Why? A big reason is seasonal adjustments in the data.
Normally, one of the easiest and clearest seasonal adjustments is teachers. They’re laid off at the same time every year and hired at the same time every year. So you discount the lay offs in June/July and the hires in Aug/Sept. It all washes out.
This year though, teachers were laid off early — in April, May and June.
In the BLS model, most of those layoffs are supposed to happen in July. So what happens is they add nearly 1 million jobs to the total before they even start counting. The thing is, those layoffs haven’t happened this year.
teacher
Because of that effect, job losses were overestimated in April/May and now will be added back in July. They estimate the effect at +850K jobs.
Still, that number could be fluid and the assumptions and adjustments the BLS makes will be critical in how it turns out. The risk is that it shows a skewed picture.
Given that, the better spot to watch may be the unemployment rate, which is taken from the household survey. This has its own problems because many people laid off because of COVID-19 have been misclassified — a problem the BLS has been struggling to correct. The consensus there is an improvement to 11.2% from 12.3%. Private payrolls (consensus +1398K) could also offer a clearer look at the economy excluding teacher effects.
As for trading it, watch out for people pointing to the seasonal adjustment effect after the fact. But note that it should already be priced in.

Amazon’s Bezos sold $1.9 billion of his shares …. yours!

Reuters with the report on stock sales by Amazon head and founder Jeff Bezos.

  • During the first two working days of August, Bezos sold over 600,000 shares
  • part of a previously announced trading plan
Bezos now only has 54.9 million shares left (roughly $176 billion). I know you’ll join me in sending thoughts and prayers. 😀
Reuters with the report on stock sales by Amazon head and founder Jeff Bezos.

Bond’s send out a distress signal

All is not well-

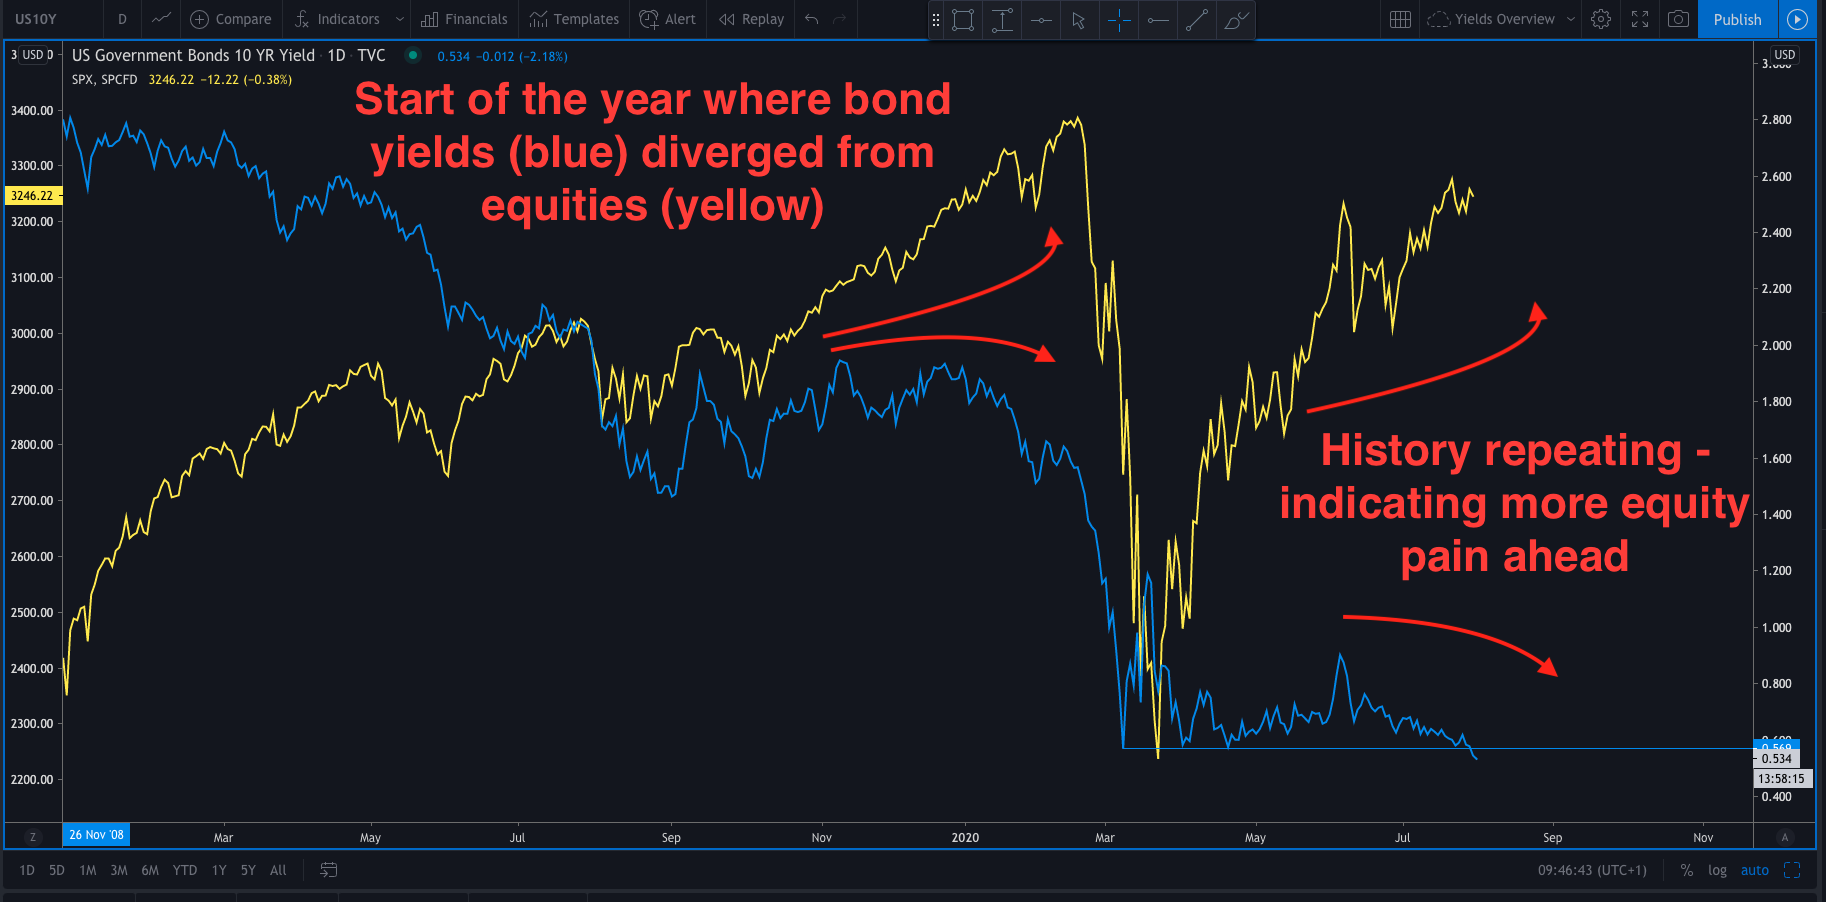
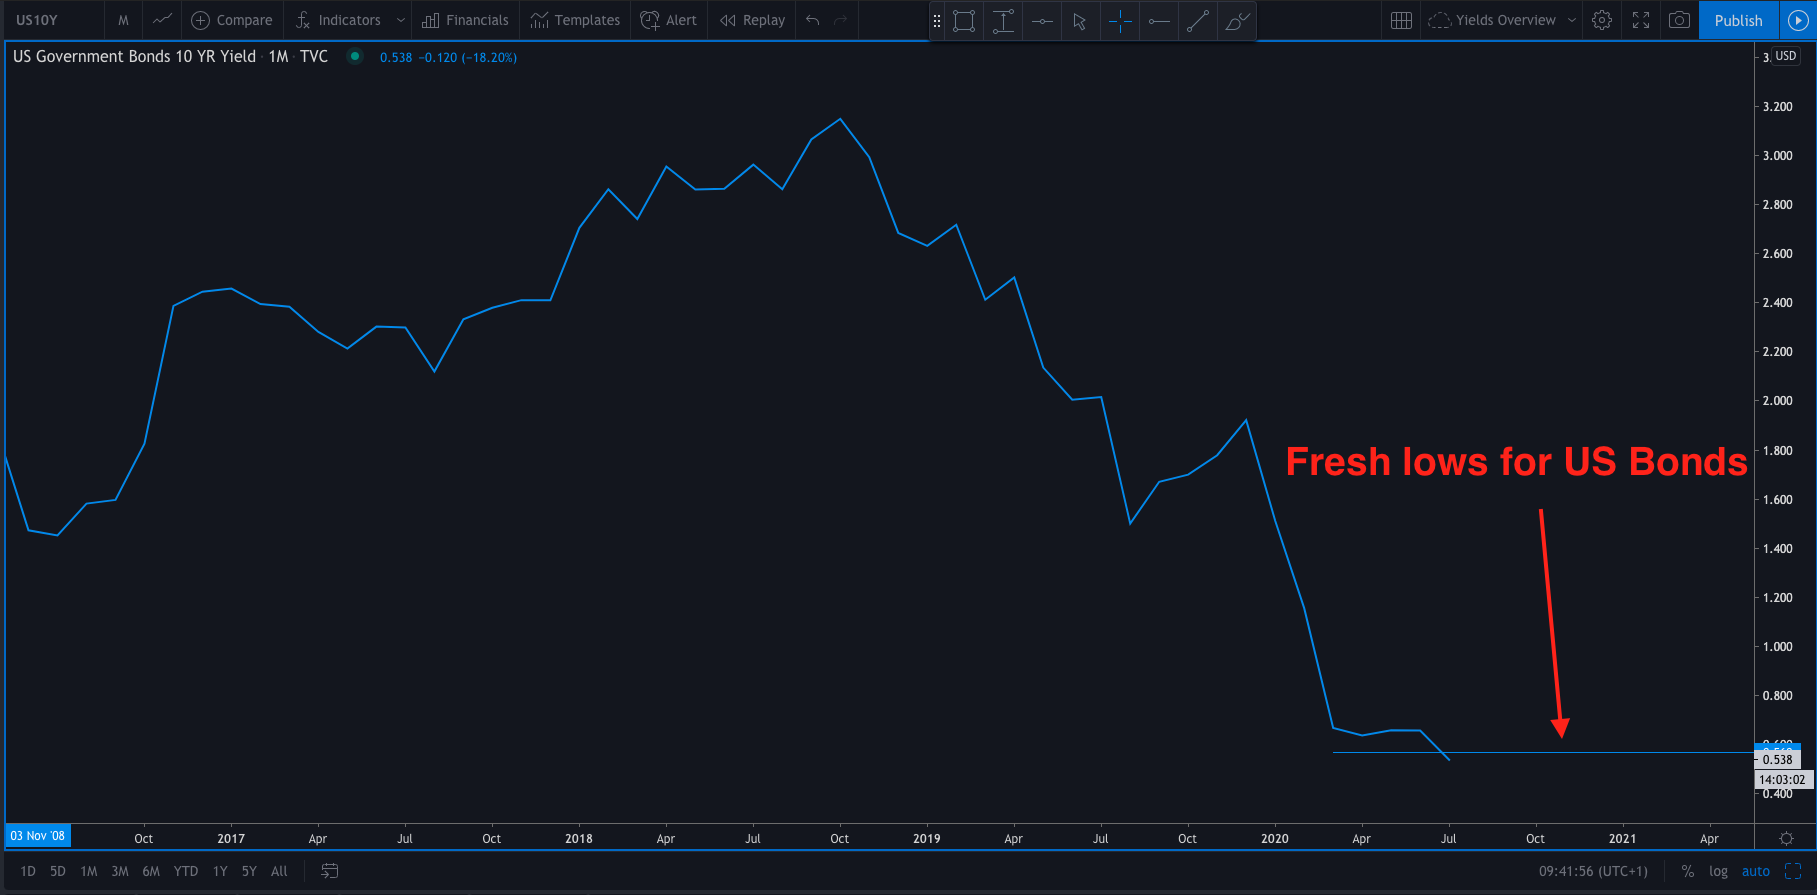
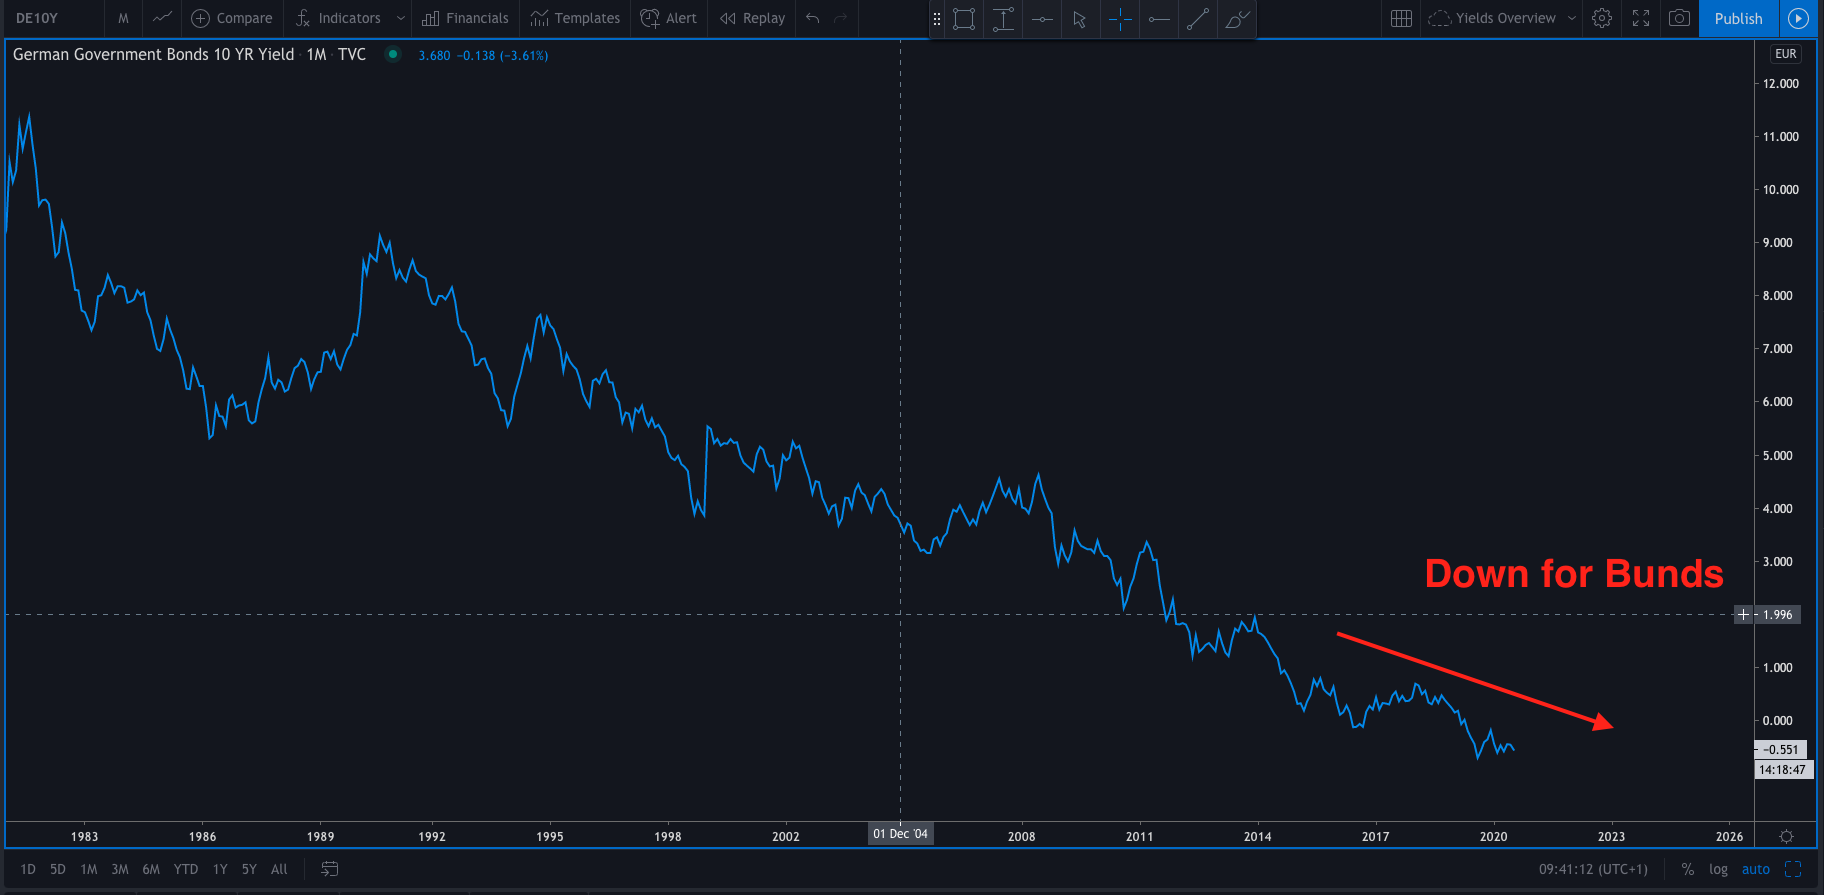
The constant fall in Bond yields is sending out a signal that all is not well in the world. The tail end of last week may have seen some excellent earnings from facebook, apple, amazon and alphabet and that started a fresh equity rally early Friday. However, the fall of Bond yields is saying, ‘look out! There may be trouble ahead. For the uninitiated bond traders tend to take a more long tern macro view. So, when equities rise, but bond yields are falling that is a signal something is wrong.

If you can recall at the start of the year one of the big questions was which market is right? Falling and yields or rising equities? The answer has been, ‘the falling bond yield market’. So, the general rule of thumb is go with the bond yield market. Now, of course this doesn’t mean that a funny divergence can last for weeks and months. However, at the very least it is a warning sign. That warning sign is showing again.

All is not well- 

Yields are dropping

The 10Y Gilt yield (UK bond) hit a record low last week. The 10Y Bund (German bond) closed at its lowest level since mid-May on Thursday last week, while the 10 y UST (US bond) was down towards its lowest ever close last week too.

Bonds

SP500

Why are they dropping?

The proverbial tea leaves are being read and a second wave of COVID-19 is being seen ahead. This will mean more monetary and fiscal policy help to get through the pandemic.So, yes the equity market has been rallying on the central bank support. However, the bond market is saying that the next stage of the global economy is fraught with dangers and a ‘V’ shaped recovery is more hope than reality.

China’s Global Times says “New cold war will not stop US decline”

An opinion piece in state news organ Global Times

  • What is deeply worrying is the unpredictability, volatility and desperation of Trump. Driven by his fear of losing the presidential election in November, Trump sees nothing is off the table as far as he is concerned. Anything is possible. 
Of course, there is plenty more, link here
Over the weekend Pompeo spoke of further action against Chinese firms:
  • US to widen action against Chinese tech groups beyond TikTok

An opinion piece in state news organ Global TimesI think I am going to have find a cartoon of Xi and Trump engaged in a more violent sport rather than this tame effort.

USA credit rating outlook revised to negative from stable by Fitch

Bold move by the rating agency

USA downgrade Fitch
The rating was affirmed at AAA but lowered to negative from stable. That’s how you get yourself a lawsuit.
  • Cites ongoing deterioration in public finances
  • Sees general debt to GDP above 130% by 2021
  • Expects deficit to narrow to 11% of GDP in 2021
  • Expects US economy to contract 5.6% this year
  • Statement
What Fitch had to say:
The Outlook has been revised to Negative to reflect the ongoing deterioration in the U.S. public finances and the absence of a credible fiscal consolidation plan, issues that were highlighted in the agency’s last rating review on March 26, 2020. High fiscal deficits and debt were already on a rising medium-term path even before the onset of the huge economic shock precipitated by the coronavirus. They have started to erode the traditional credit strengths of the US.
They’re not wrong.
Another risk they cite is the possibility of policy gridlock after the election because neither party will get a 60-seat Senate majority.

China infrastructure stimulus – 3 times as many pile drivers are sold as are sold in all of US & Europe

A piece in the New York Times that makes for an interesting read.

  • The scope of China’s latest building boom is enormous
  • Thirty-seven Chinese cities are in the process of building a total of 150 new subway lines
  • The country’s high-speed rail system, which already connects more than 700 towns and cities, is expanding so fast that it annually buys three times as many pile drivers as the European and American markets combined. 
Here is the link for more (may be gated)
china infrastuctre thumbs

More info on that Russian COVID-19 vaccine: 30 million doses in Russia by end of year and 170 million worldwide

The Russian vaccine speculation is not new, but here is more on it if you need.

Head of its sovereign wealth fund Kirill Dmitriev, chief executive of the Russian Direct Investment Fund, which is financing the country’s vaccine research:
  • Russia aims to secure approval for the first Covid-19 vaccine in the first two weeks of August
  • expects to produce 30 million doses in Russia by end of year and 170 million worldwide
The Russian vaccine speculation is not new, but here is more on it if you need.

UK think tank says unemployment will reach 10% this year

UK think tank, NIESR, comments on the UK economy

UK
  • Sees unemployment rate hitting almost 10% this year due to “premature” end to the government’s furlough program
  • Says government is making a mistake by cutting furlough program in October
  • Says that increases the risks of economic scarring
  • Forecasts UK economy to shrink by 10.1% in 2020, before growing by 6.1% in 2021

That is one take on the whole situation but if the health crisis gets worse in the coming months, who is to say that the UK government would not use that as an excuse to keep the furlough program running until the year-end.

For now, a lot about UK economic data – especially in relation to the labour market – is largely masked by the fact that the government’s furlough program is in place.
We will only get a better idea of how the economy is standing on its own two feet once the program expires. Things may be looking “good” for now but should there be substantial layoffs to come, it could lead to a bigger hit to the economy down the road.
Go to top