
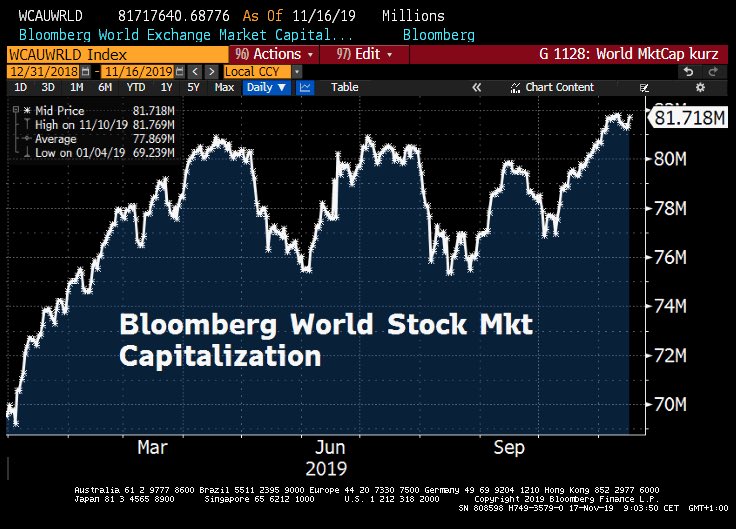
Global mkt cap now near $82tn, equates to 94% of global GDP, just shy of Buffett’s 100% bubble indicator.


Details:
Inflation:
 June 8 (Reuters) – The U.S. debt will top $13.6 trillion this year and climb to an estimated $19.6 trillion by 2015, according to a Treasury Department report to Congress.
The report that was sent to lawmakers Friday night with no fanfare said the ratio of debt to the gross domestic product would rise to 102 percent by 2015 from 93 percent this year.
“The president’s economic experts say a 1 percent increase in GDP can create almost 1 million jobs, and that 1 percent is what experts think we are losing because of the debt’s massive drag on our economy,” said Republican Representative Dave Camp, who publicized the report.
He was referring to recent testimony by University of Maryland Professor Carmen Reinhart to the bipartisan fiscal commission, which was created by President Barack Obama to recommend ways to reduce the deficit, which said debt topping 90 percent of GDP could slow economic growth.
The U.S. debt has grown rapidly with the economic downturn and government spending for the Wall Street bailout, the wars in Afghanistan and Iraq and the economic stimulus. The rising debt is contributing to voter unrest ahead of the November congressional elections in which Republicans hope to regain control of Congress.
The total U.S. debt includes obligations to the Social Security retirement program and other government trust funds. The amount of debt held by investors, which include China and other countries as well as individuals and pension funds, will rise to an estimated $9.1 trillion this year from $7.5 trillion last year.
“The longer our obsession with GDP goes on, the longer the issues that really matter to people across the globe will continue to go ignored,” Mr Green said. “It’s not a measure of our well-being and it shouldn’t be a guide to all decision making.”
“But we have ignored Kusnets’ warning,” said Mr Green, and we now talk about GDP as if it were “handed down from God on tablets of stone”. But major institutions are now weighing in with alternative measures of growth.
 Investors are understandably scared of the sovereign debt crisis unfolding in Europe. Amid their angst, however, they are ignoring a more likely, and significantly larger, debt catastrophe that is about to hit the nation with the second-largest economy in the world — Japan. Two decades of stimulative, low-interest-rate fiscal policy have made Japan the most indebted nation in the developed world, and as new Prime Minister Naoto Kan recently said, in his first address to Parliament, that situation is not sustainable. Japan has little choice but to raise interest rates substantially, with dire consequences far beyond its shores.
The prelude to the current crisis began in the early 1990s, after Japan’s housing and stock market bubbles burst and its economy slipped into recession. For the next 20 years, using flashy names like Fiscal Structural Reform Act, Emergency Employment Measures and Policy Measures of Economic Rebirth, the government cut taxes, increased spending and borrowed money to finance itself. Today, Japan’s ratio of debt to gross domestic product stands at almost 200 percent, more than twice that of the U.S. and Germany and second only to Zimbabwe. (more…)
Barely over a week ahead of release of the official GDP data, research and analytical firm ZyFin today estimated India’s economy to expand by 4.7% in the second quarter of the current financial year. The methodology used by ZyFin is distinct and it claimed that it uses variables which are lead indicators to the official data. If GDP indeed grows by this rate, the Finance Ministry’s hopes of GDP growth between 5-5.5% in 2013-14 may be dashed.
With Chinese data now an official farce even among Wall Street economists, tenured academics, and all others whose job obligation it is to accept and never question the lies they are fed, the biggest question over the past year has been just what is China’s real, and rapidly slowing, GDP – which alongside the Fed, is the primary catalyst of the global risk shakeout experienced in recent weeks.
One thing that everyone knows and can agree on, is that it is not the official 7% number, or whatever goalseeked fabrication the communist party tries to push to a world that has realized China can’t even manipulate its stock market higher, let alone its economy.
But what is it? Over the past few months we have shown various unpleasant estimates, the lowest of which was 1.6% back in April.
Today we got the worst one yet, courtesy of Evercore ISI, which using its own GDP equivalent index – the Synthetic Growth Index (SGI) – gets a vastly different result from the official one, namely Chinese growth of -1.1% annually. Or rather, contraction.
To wit, from Evercore:
Our proprietary Synthetic Growth Index (SG!) fell 1.1% mim in July, and was also down 1.1% y/y. No wonderglobal commodities are so weak. The most recent 18 months have been much weakerthan the 2011-13 period. Even if we adjust our SG I upward (for too-little representation of Services — lack of data), we believe actual economic growth in China is far below the official 7.0% yly. And, it is not improving, Most worrisome to us; the ‘equipment’ portion of Plant & Equipment spending is very weak, a bad sign for any company or country. Expect more monetary and fiscal steps to lift growth.
And here is why the world is in big trouble.
