It’s impossible to hedge
The big risk in the FX market is that there are massive flows of unhedged foreign bond buying in the US.
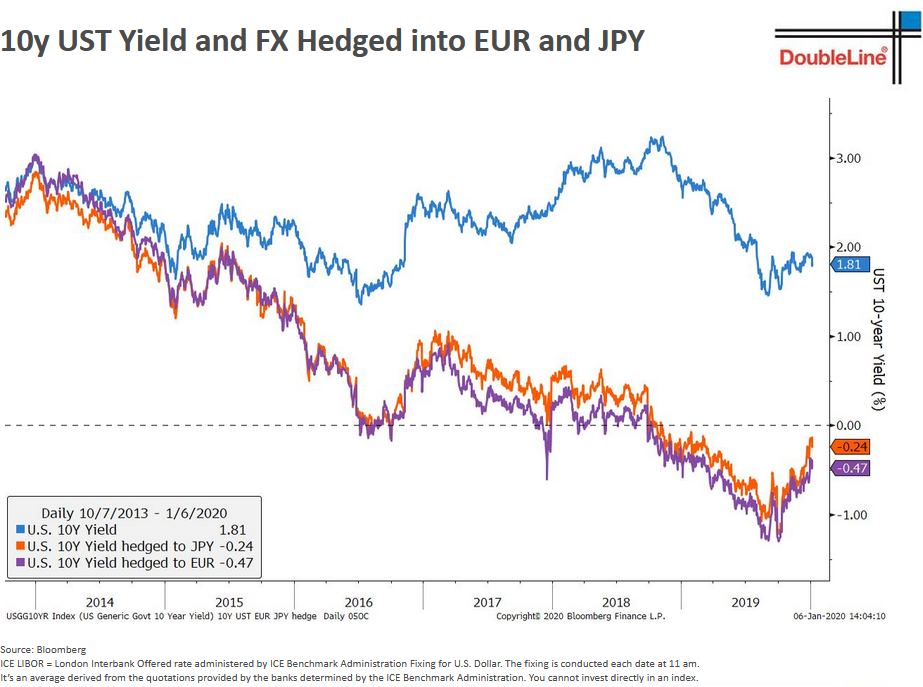
The problem is that Japanese and European investors can’t get positive yield. A traditional option is to buy foreign bonds and hedge in a classic carry trade. The problem he highlights here is that you can’t do that now because the hedge pushes the return into negative territory.
So instead the theory is that they’re buying Treasuries unhedged. That is a wildly risky trade because you’re getting 1.8% a year for 10 years but the currency could drop 18%. What could happen is that if/when the US dollars falls, it starts a rush to the exits and you get a very quick, very painful drop and overshoot.
That should be a key risk that everyone is watching, especially with a President who wants a weaker currency.


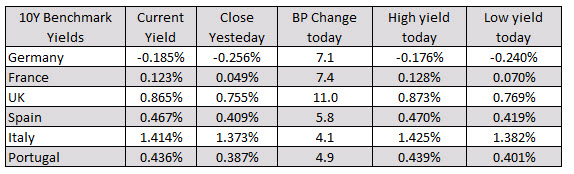 In other markets as European traders exit: