rss

The greater the story, the greater the bubble

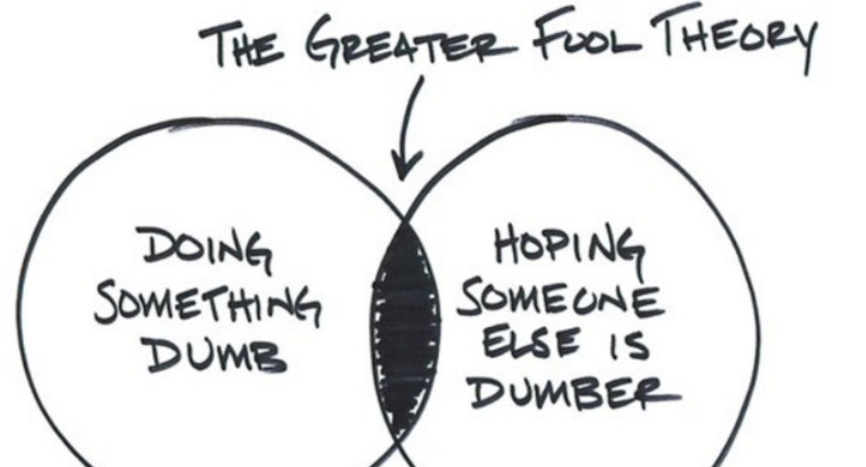
The greater fool theory explains almost every bubble

Some things have an intrinsic value. The most-obvious example is a stock with a dividend. The absolute floor for an equity is its dividend and so long as their is a profitable business behind it, the value is a multiple of that dividend.

Other things don’t have an intrinsic value. This includes virtually everything that doesn’t produce a yield. Oftentimes, prices of those things rise and fall based on future expectations of what profits or yield might be. In other cases, there is an estimation of utility. Oil, for instance, can be refined into gasoline which can be used to move things or for dozens of other uses.

Oftentimes there is a dispute about utility or a dispute about future profitability, which can lead to a dispute about prices. One way to resolve this is a model but oftentimes that’s so fraught with assumptions that it’s useless.

So how do you establish prices? Obviously, via the market.

This is when storytelling, which is another way of saying a sales job, takes over.

Cryptocurrencies are an obvious example. A Bitcoin has no yield but it has some utility. To some, that utility is replacing the US dollar as a global transparent currency. To others, it’s a way to facilitate transactions. And for others still, it’s a handy tool for criminal transactions. How you price it then, depends on how you view the future utility.

Or does it? (more…)

2 Thoughts For Traders

It is impossible to make money trading without an edge.

There are many ways to create an edge in the markets, but one this is true—it is very, very hard to do so. Most things that people say work in the market do not actually work. Treat claims of success and performance with healthy skepticism. I can tell you, based on my experience of nearly twenty years as a trader, most people who say they are making substantial profits are not. This is a very hard business.

Every edge we have is driven by an imbalance of buying and selling pressure.

The world divides into two large groups of traders and investors: fundamental traders who base decisions off of financial analysis, understanding of the industry and a company’s competitive position, growth rates, assessment of management, etc. Technical traders base decisions off of patterns in prices, volume or related data. From a technical perspective, every edge we have is generated by a disagreement between buyers and sellers. When they are in balance (equilibrium), market movements are random.

Trading Errors When Trend Following

Who really wants to define a loss? Only smart trend followers. Most people think they can postpone a loss. They become investors instead of traders. Many refuse to define a loss. I have seen traders not close a losing trade, after they realized that the trade’s potential is greatly diminished and has gone against them. They want to right. All the way to the poor house. This is a typical trading error when trend following. You need an exact plan when you are trend following. You can not make it up as you are going. This is what losers do. Besides having the exact plan you must believe in it and follow it. Do not think of the money. Think in terms of percentages. Follow your rules and stay in the marathon of trend following. Successful trend following is not about tips or magic indicators. It is about you and how you approach the markets. You must be willing to take losses once it is clear the trade is not working.

Past performance is not necessarily indicative of future performance. The risk of loss in trading futures contracts, commodity options or forex can be substantial, and therefore investors should understand the risks involved in taking leveraged positions and must assume responsibility for the risks associated with such investments and for their results. You should carefully consider whether such trading is suitable for you in light of your circumstances and financial resources.

3 Types of Traders

Three popular trading personality types are intuitive, data oriented, and impulsive.

The data-oriented trader focuses on concrete evidence and is often very risk averse. They seek out as much supporting data for a trading decision as possible. The trader who prefers to do extensive back-testing of a trading idea exemplifies data-oriented type. Consider incorporating elements of data oriented trader personality into your trading style regardless of your natural inclinations.  Make sure you have adequate information (a reason) before executing a trade. Particularly important is to have and trade a detailed trading plan in which risk is minimized and entry and exit strategies are clearly specified. Most often however, the data-oriented trader may take things a little too far. Searching for “the perfect” knowledge that just doesn’t exit in the trading world. At some point, one must accept the fact that he or she is taking a chance and no amount of data analysis can change this fact.

The intuitive trader is the opposite of the data-oriented trader. Trading decisions are based upon hunches and impressions rather than on clearly defined data. There’s a difference between being an intuitive trader who develops this style over time and one who is naturally intuitive. The experienced intuitive trader, bases decisions on data and specific market information. But, as a seasoned trader, analyzes the data quickly and efficiently. It happens so quickly that it seems like it occurs intuitively, but it is actually based on solid information. Ideally, all traders should gain extensive experience to the point where sound decisions are made with an intuitive feel.

A third trader personality type is the impulsive trader (gambler). This is the most dangerous style. The impulsive trader allows his or her decisions to adversely influence trading decisions. Rather than looking at information logically and analytically, information is discounted completely. The impulsive trader seeks out risk and enjoys taking risky, exciting trades. Impulsive traders can often make huge profits one day and see large draw downs the next. Your personality can have a huge influence on your trading performance. Identify your assets and liabilities, and work around your personality when it is necessary. 

Every Trader Must Read These 10 Points -Take Print Out

  1. An entry does not determine profitability it only determines potential profit the exit is where the win or loss occurs, focus on that.
  2. A robust trading system means nothing unless you can follow it with discipline and self control.
  3. Charts don’t care about any one persons opinions why should you?
  4. Good trading will make you some money but only good risk management will allow you to keep the money.
  5. Good traders search for the right entries, great traders search for the right systems.
  6. Bad traders have an opinion, good traders have a plan.
  7. In the markets money flows continually from those you do not really know how to trade to those who do.
  8. Eventually those with the best risk management and trading method end up with the money from those who only have a good  trading method.
  9. Bad traders tend to be stressed and emotional, good traders tend to be more quiet and at ease.
  10. Show me a trader overly focused on just one trade and I will show you the 90% that are unprofitable, show me a trader focused on the whole process of trading with little concern over any one trade and I will show you a member of the 10% that are profitable.

Trading Wisdom by – Jon Tait

One of the most puzzling paradoxes of trading is that you have to show up every day, but most days your best move is to do nothing.

I don’t day trade, but I do look at a lot of time horizons, sometimes as short as 1 minute bars. But I’ve learned to focus my attention on shorter time horizons only when longer time horizons are at a critical juncture. My trading life became much simpler when just owning a stock was no longer a reason to look at a shorter time horizon than daily bars. I don’t even load up the quote streamer until I’ve made the decision to buy or sell a stock that day based on daily and weekly charts.

It can be more optimal to trade extremely short time horizons, but the benefits of trading very short term don’t scale linearly due to transaction costs becoming more difficult to beat. 

For me, it is important to not have to grind for every dollar. I don’t want a full time job from the markets, but I do want to make high returns on my money, so I consistently reform my trading to be in line with these goals.

I start off every campaign in a stock very fickle, weak handed. As a position works for me and I pyramid into a larger position, I become a strong hand; I’m dug in.

Jesse Livermore and natural disasters

Those of you who have read Reminiscences of a Stock Operator, Edwin Lefevre’s classic book reportedly based on Jesse Livermore, will know that ‘Larry Livingston’(Livermore) profited from shorting stocks immediately prior to the 1906 San Francisco earthquake. Initially the market held up, but Livermore was patient enough to sit in his positions, and the market finally succumbed to a sharp downdraft after a couple days.

In Michael Covel’s book Trend Following, there is a section devoted to major events that have occurred, which have significantly affected the markets, and that it was pointed out how often a trend follower was trading in the correct direction at that particular time. By definition, a trend follower would be trading in the correct direction when there is a major market specific event (such as the 1987 market crash, the dot.com bubble, the 2008 crash etc), but also more often than not when other major events occur, such as the collapse of Barings Bank, 9/11 etc.

Back to Livermore. While he started shorting stocks on a hunch prior to the earthquake, I follow the trend on the indices as a basis for whether I should be long or short stocks. Indeed, Livermore himself came to the same conclusions:

“I began to see more clearly – perhaps I should say more maturely – that since the entire list moves in accordance with the main current… Obviously the thing to do was to be bullish in a bull market and bearish in a bear market. Sounds silly, doesn’t it? But I had to grasp that general principle firmly before I saw that to put it into practice really meant to anticipate probabilities. It took me a long time to learn to trade on those lines.”

(more…)

Balenthiran 17.6 Year Cycle

Interesting take on the longer term Secular Bear Market Vs. Cyclical Bull Market, via Kerry Balenthiran:

“My research has identified that a 17.6 year stock market exists within the markets consisting of downtrends lasting 2.2 years and uptrends lasting 4.4 years (2 x 2.2 years), with a combined cycle length of 17.6 years. I have called this cycle the Balenthiran Cycle and demonstrate how the intermediate turning points match stock market behavior going back to the early 1900s and extrapolate the cycle forwards to provide a market roadmap of the next secular bull market to 2035 and subsequent secular bear market to 2053.”

A few caveats: The 17.6 year cycle has been bantered about for a long time by various people. (See “previous” below).

Second, I would add is that cycles can be interrupted by external events — like Bailouts, QE, etc.

Last, the world changes over time, and I doubt that any oscillation period dependent upon humans would stay all that consistent over decades and centuries.

How Does Buffett Make So Much Money? Not How You Think!

Excerpt:

Berkshire Hathaway has realized a Sharpe ratio of 0.76, higher than any other stock or mutual fund with a history of more than 30 years, and Berkshire has a significant alpha to traditional risk factors. However, we find that the alpha becomes insignificant when controlling for exposures to Betting-Against-Beta and Quality-Minus-Junk factors. Further, we estimate that Buffett’s leverage is about 1.6-to-1 on average. Buffett’s returns appear to be neither luck nor magic, but, rather, reward for the use of leverage combined with a focus on cheap, safe, quality stocks. Decomposing Berkshires’ portfolio into ownership in publicly traded stocks versus wholly-owned private companies, we find that the former performs the best, suggesting that Buffett’s returns are more due to stock selection than to his effect on management. These results have broad implications for market efficiency and the implementability of academic factors.

Buffett’s record is remarkable in many ways, but just how spectacular has the performance of Berkshire Hathaway been compared to other stocks or mutual funds? Looking at all U.S. stocks from 1926 to 2011 that have been traded for more than 30 years, we find that Berkshire Hathaway has the highest Sharpe ratio among all. Similarly, Buffett has a higher Sharpe ratio than all U.S. mutual funds that have been around for more than 30 years.

We document how Buffett’s performance is outstanding as the best among all stocks and mutual funds that have existed for at least 30 years. Nevertheless, his Sharpe ratio of 0.76 might be lower than many investors imagine. While optimistic asset managers often claim to be able to achieve Sharpe ratios above 1 or 2, long-term investors might do well by setting a realistic performance goal and bracing themselves for the tough periods that even Buffett has experienced.

In essence, we find that the secret to Buffett’s success is his preference for cheap, safe, high-quality stocks combined with his consistent use of leverage to magnify returns while surviving the inevitable large absolute and relative drawdowns this entails. Indeed, we find that stocks with the characteristics favored by Buffett have done well in general, that Buffett applies about 1.6-to-1 leverage financed partly using insurance float with a low financing rate, and that leveraging safe stocks can largely explain Buffett’s performance.

 
Source: Andrea Frazzini, David Kabiller and Lasse H. Pedersen, “Buffett’s Alpha.”

Go to top