rss

Tracking Global Corporate Tax Avoidance

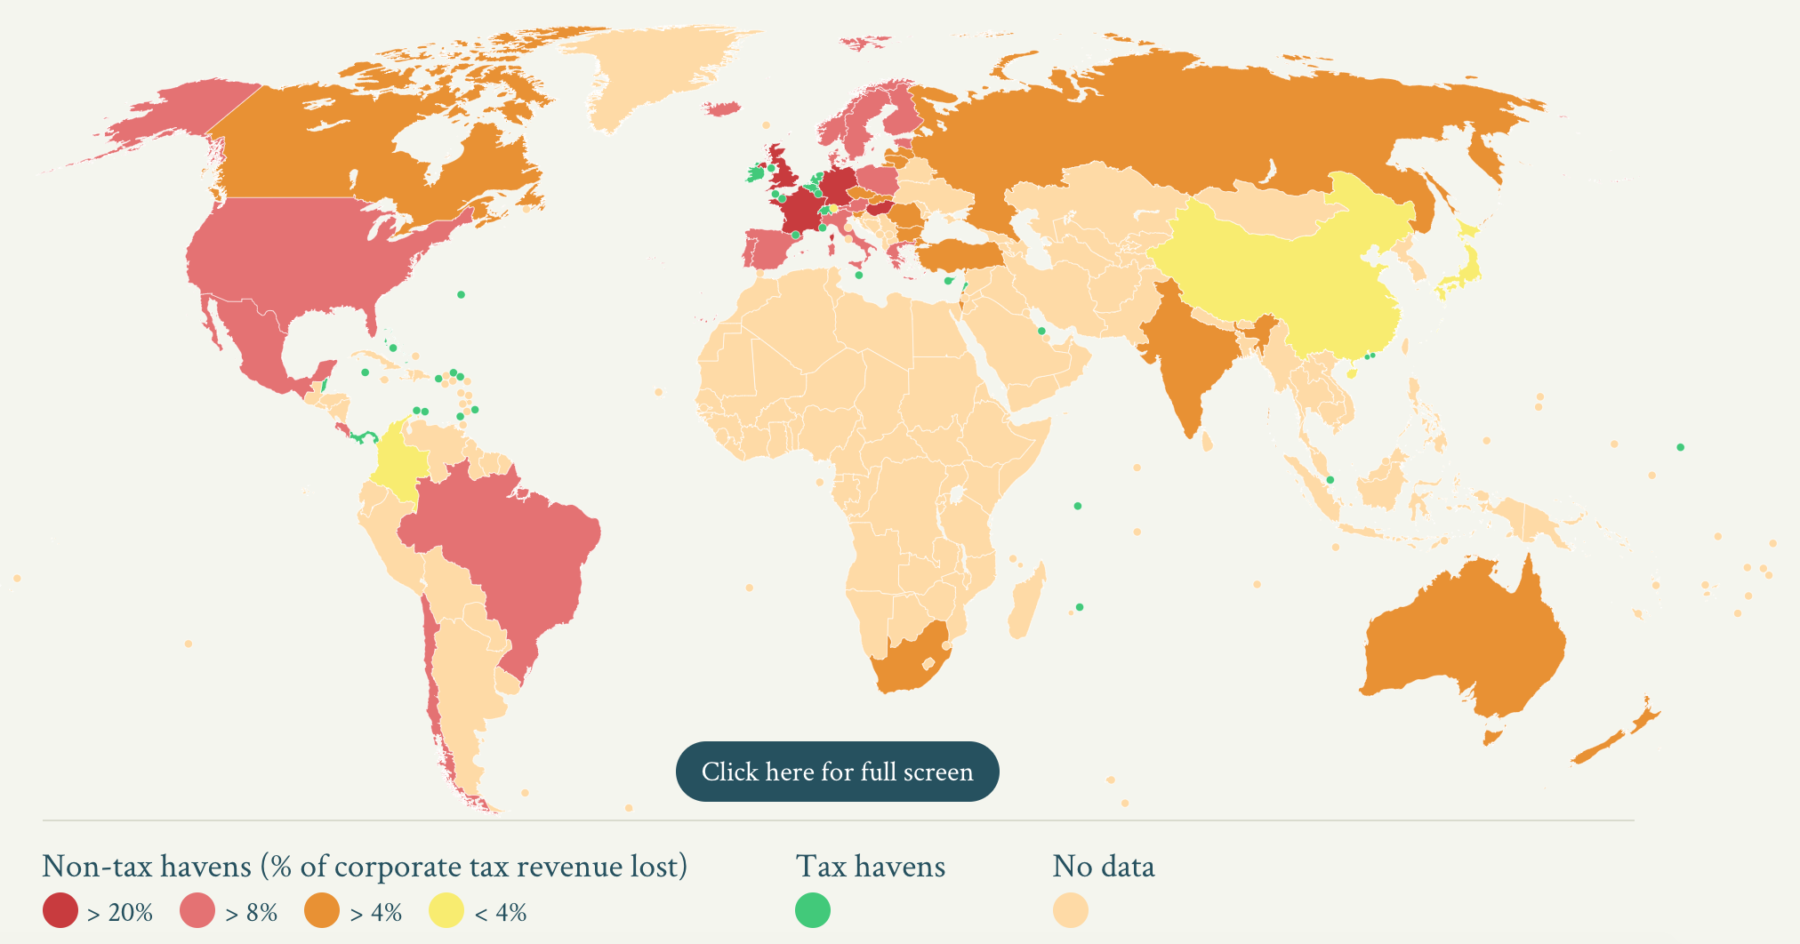
40% of multinational profits are shifted to tax havens each year


Source: Missing Profits


Globally, about $650 billion in profits are shifted to such tax havens by multinational from all countries. This fascinating research project from the University of California at Berkeley and the University of Copenhagen is an attempt to track all of those tax avoiding dollars, to see which countries attract and lose profits in this shell game.

Missing Profits:

The loss of profit is the highest for the (non-haven) European Union countries. U.S. multinationals shift comparatively more profits (about 60% of their foreign profits) than multinationals from other countries (40% for the world on average). The shareholders of U.S. multinationals thus appear to be the main winners from global profit shifting. Moreover, the governments of tax havens derive sizable benefits from this phenomenon: by taxing the large amount of paper profits they attract at low rates (less than 5%), they are able to generate more tax revenue, as a fraction of their national income, than the United States and non-haven European countries that have much higher tax rates.

German media report that USD will be 50% backing for Facebook crypto Libra

Weekend report in Reuters on the cryptocurrency, citing Speigel

US dollar will make up 50 percent of the basket of currencies backing Facebook’s planned digital coin Libra
euro, yen, sterling and Singapore dollar comprising the rest
yuan will not be included
Exclusion of yuan “could help smooth the planned cryptocurrency’s path in the United States” says Reuters
More:
  • US dollar would make up 50 percent of the basket
  • euro with 18 percent
  • yen with 14 percent
  • GBP 11 percent
  • SGD 7 percent
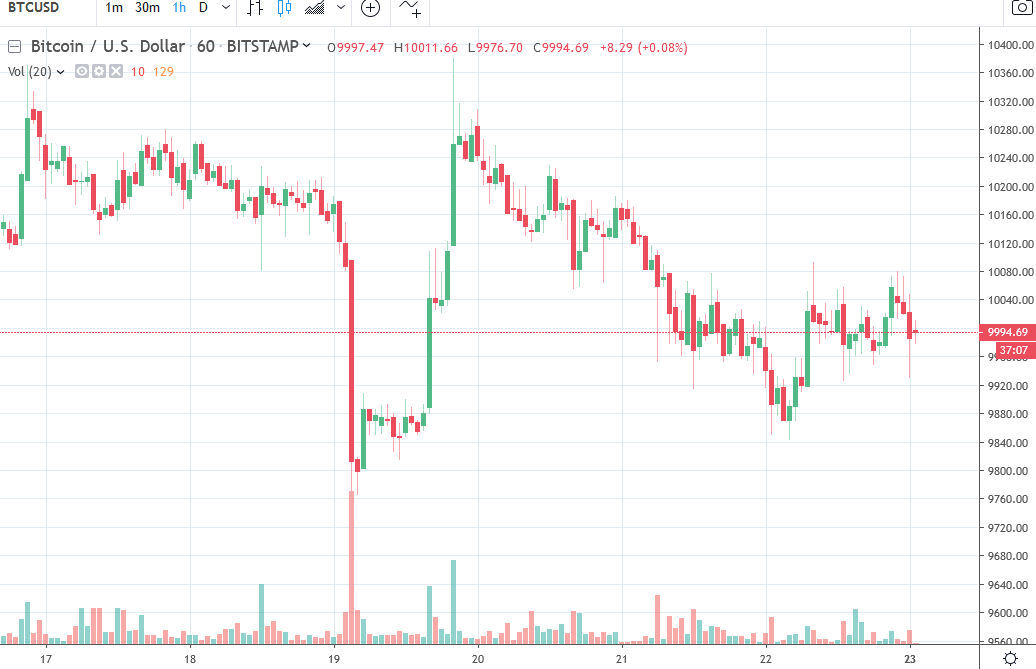
While we are at it, BTC update:
Weekend report in Reuters on the cryptocurrency, citing Speigel

Crucial Update :US Dollar Index ,EURO ,YEN ,GBP ,INR ,CAD ,AUD ,PESO ,WTI ,SPX 500 -Anirudh Sethi

The Japanese yen and Canadian dollar were the only major currencies to gain against the US dollar last week.  They are also the only major currencies to appreciate against the dollar so far this year.  US President Trump’s apparent playing down of the pressure to strike a partial deal with China before the 2020 election weighed on stocks and lifted the so-called safe-haven currencies ahead of the weekend.  When everything was said and done, from the attack on Saudi Arabia to the money market squeeze in the US and the Fed’s rate cut, the dollar remained mostly within well-worn ranges.
The exceptions were idiosyncratic.  Growth concerns, both globally and domestically, saw the New Zealand dollar fall to new four-year lows ahead of the weekend.  The RBNZ meets next week, and the market has about six basis points of easing, or about a 25% chance of a cut.  The Australian dollar fell in four of last week’s five sessions and the day rose was by 1/100 of a penny, according to Bloomberg.  Sterling had threatened to break high in the second half of the week, but Ireland’s Deputy Prime Minister helped put Juncker’s seeming optimism in context.  UK Prime Minister Johnson reportedly acknowledged that the EU is unlikely to agree entirely with his proposal at the critical summit in the middle of next month.  These developments pushed sterling a cent off the highest level since July (~$1.2580).
   To read more enter password and Unlock more engaging content

US Indices close the day down and also close lower on the week

Nasdaq falls 0.8% to today

The major US stock indices are ending the session in the red for the day. The declines today also helped push/keep the week lower.
The final numbers are showing:
  • S&P index -14.72 points or -0.49% at 2992.07.
  • NASDAQ index -65.20 points or -0.80% at 8117.68
  • Dow industrial average -159.72 points or -0.59% at 26935.07
For the week, the major indices fell with the Dow industrial average falling the most.
  • S&P index, -0.51%
  • NASDAQ composite index -0.72%
  • Dow industrial average, -1.05%

US Indices close with mixed results. Earlier gains taken away.

S&P unchanged. Nasdaq up marginally. Dow down.

The major US stock indices are closing the day with mixed results.  Each however had earlier gains taken away into the close.
Looking at the three major indices, one ended unchanged, one was up marginally and one was down.  The final numbers are showing:
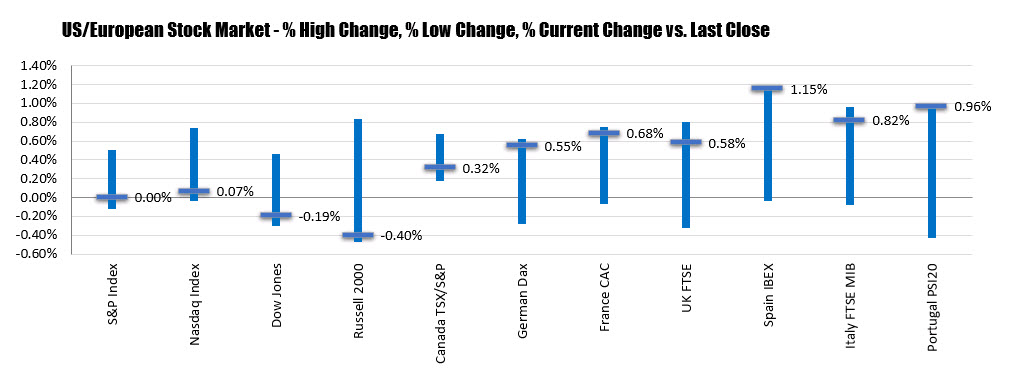
  • S&P index, unchanged at 3006.79. The high reach 3021.99.. The low extended to 3003.16
  • NASDAQ closed up 5.487 points or 0.07% at 8182.87. The high reached 8237.43. The low extended 28174.32
  • The Dow industrial average closed down -52.29 points or -0.19% at 27094.79. The high reached 27272.17. The low extended to 27064.21.
The chart below shows the percentage change high, the percentage change low, and the closing percentage change for the major North American and European stock indices today. European shares closed near their high levels for the day. The US major indices closed near their session lows.
S&P unchanged. Nasdaq up marginally. Dow down.
What seemed to be a negative catalyst for stocks was a report that a White House official commented that tariffs on China could go as high as 50 to 100%. That spooked the market and prices started to ratchet lower.

OECD sees global economy slipping towards weakest growth in a decade

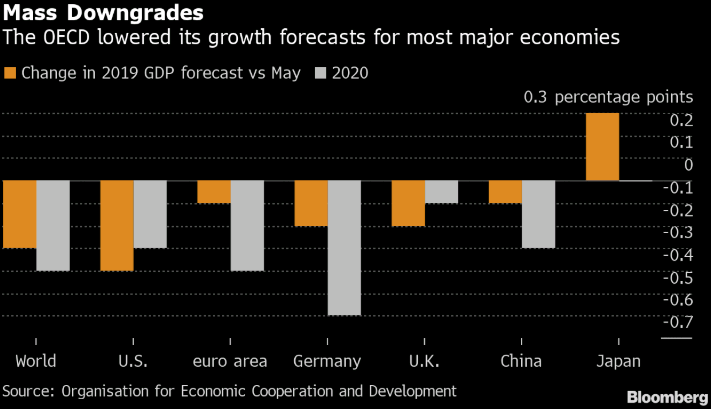
OECD cuts forecasts to the global economy, warns of entrenched uncertainty

Global
  • 2019 global GDP growth at 2.9% (previously 3.2%)
  • 2020 global GDP growth at 3.0% (previously 3.4%)
  • 2019 US GDP growth at 2.4% (previously 2.8%)
  • 2020 US GDP growth at 2.0% (previously 2.3%)
  • 2019 China GDP growth at 6.1% (previously 6.2%)
  • 2020 China GDP growth at 5.7% (previously 6.0%)
  • 2019 Eurozone GDP growth at 1.1% (previously 1.2%)
  • 2020 Eurozone GDP growth at 1.0% (previously 1.4%)
  • 2019 Japan GDP growth at 1.0% (previously 0.7%)
  • 2020 Japan GDP growth at 0.6% (unchanged)
  • 2019 UK GDP growth at 1.0% (previously 1.2%)
  • 2020 UK GDP growth at 0.9% (previously 1.0%)
Those are quite the amount of downgrades relative to its May forecast.
OECD says that trade tensions are the main cause for a more fragile and uncertain outlook to the global economy. Noting that intensifying trade conflicts and governments not doing enough to prevent damage will hurt global growth momentum going into next year.
The 2.9% forecast for global growth this year is the weakest projection since the financial crisis, almost a decade ago.
OECD

The FOMC September 2019 full statement

FOMC statement from the September 2019 rate decision

Information received since the Federal Open Market Committee met in July indicates that the labor market remains strong and that economic activity has been rising at a moderate rate. Job gains have been solid, on average, in recent months, and the unemployment rate has remained low. Although household spending has been rising at a strong pace, business fixed investment and exports have weakened. On a 12-month basis, overall inflation and inflation for items other than food and energy are running below 2 percent. Market-based measures of inflation compensation remain low; survey-based measures of longer-term inflation expectations are little changed.

Consistent with its statutory mandate, the Committee seeks to foster maximum employment and price stability. In light of the implications of global developments for the economic outlook as well as muted inflation pressures, the Committee decided to lower the target range for the federal funds rate to 1-3/4 to 2 percent. This action supports the Committee’s view that sustained expansion of economic activity, strong labor market conditions, and inflation near the Committee’s symmetric 2 percent objective are the most likely outcomes, but uncertainties about this outlook remain. As the Committee contemplates the future path of the target range for the federal funds rate, it will continue to monitor the implications of incoming information for the economic outlook and will act as appropriate to sustain the expansion, with a strong labor market and inflation near its symmetric 2 percent objective.

In determining the timing and size of future adjustments to the target range for the federal funds rate, the Committee will assess realized and expected economic conditions relative to its maximum employment objective and its symmetric 2 percent inflation objective. This assessment will take into account a wide range of information, including measures of labor market conditions, indicators of inflation pressures and inflation expectations, and readings on financial and international developments.

Voting for the monetary policy action were Jerome H. Powell, Chair, John C. Williams, Vice Chair; Michelle W. Bowman; Lael Brainard; Richard H. Clarida; Charles L. Evans; and Randal K. Quarles. Voting against the action were James Bullard, who preferred at this meeting to lower the target range for the federal funds rate to 1-1/2 to 1-3/4 percent; and Esther L. George and Eric S. Rosengren, who preferred to maintain the target range at 2 percent to 2-1/4 percent.
The short-term dollar funding market is feeling the squeeze

The repo market isn’t healthy

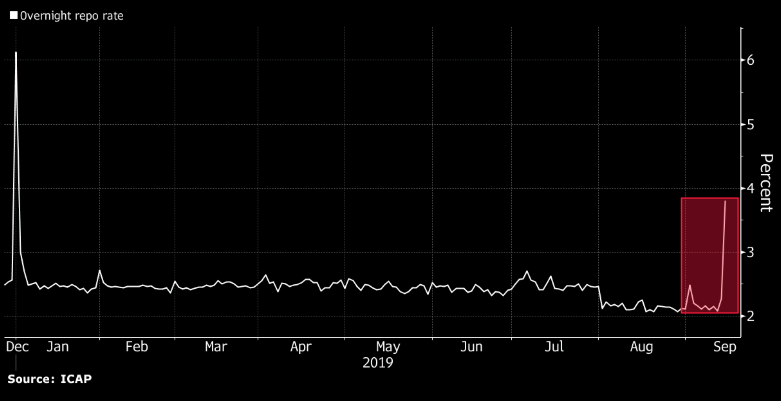
The combination of corporate debt issuance and quarterly tax payments resulted in a shortage of dollars today. That pushed the borrowing rate on overnight repos up by 153 basis points to 3.80%.
A similar phenomenon took place last December and caused much hand-wringing (but ultimately little FX movement).
The timing of this move is particularly interesting because it comes ahead of the Fed decision. There will be some focus on the Fed funds effective rate today and whether it rises from the 2.14% level today. The FOMC targets 2.00-2.25% currently and there’s talk that it’s trading at 2.20%.
Today’s move might have sparked some outright USD buying rather than borrowing among corporates and that could be what’s weighing on EUR/USD.
Keep an eye on how it develops tomorrow.
The repo market isn't healthy

Global currency trading volumes surge to highest-ever level

Trading hits $6.6 billion per day

Trading hits $6.6 billion per day
Trading in the foreign exchange market has hit $6.6 trillion per day, according to the latest survey from the Bank of International Settlements.
The BIS today reported today that volume in the survey month of April rose 29% compared to 2016. The comprehensive survey is conducted every three years.
Aside from the jump, what stands out was the rise in swaps trading — which is now nearly half the market.
Other key details:
  • 88% of all trades include USD
  • London accounts for 43% of all activity
  • US trading is 17%
  • EM currencies are now 25% of turnover
  • Trading involving the euro hit 32%
  • Trading involving the yen at 17%
  • Yuan trading is 4%
  • Spot FX trading rose 20% to $2 trillion
The changes in volumes of the major currencies was muted compared to 2016 aside from a small drop in the yen but that may have been due to lower volatility in the survey month.
Go to top