
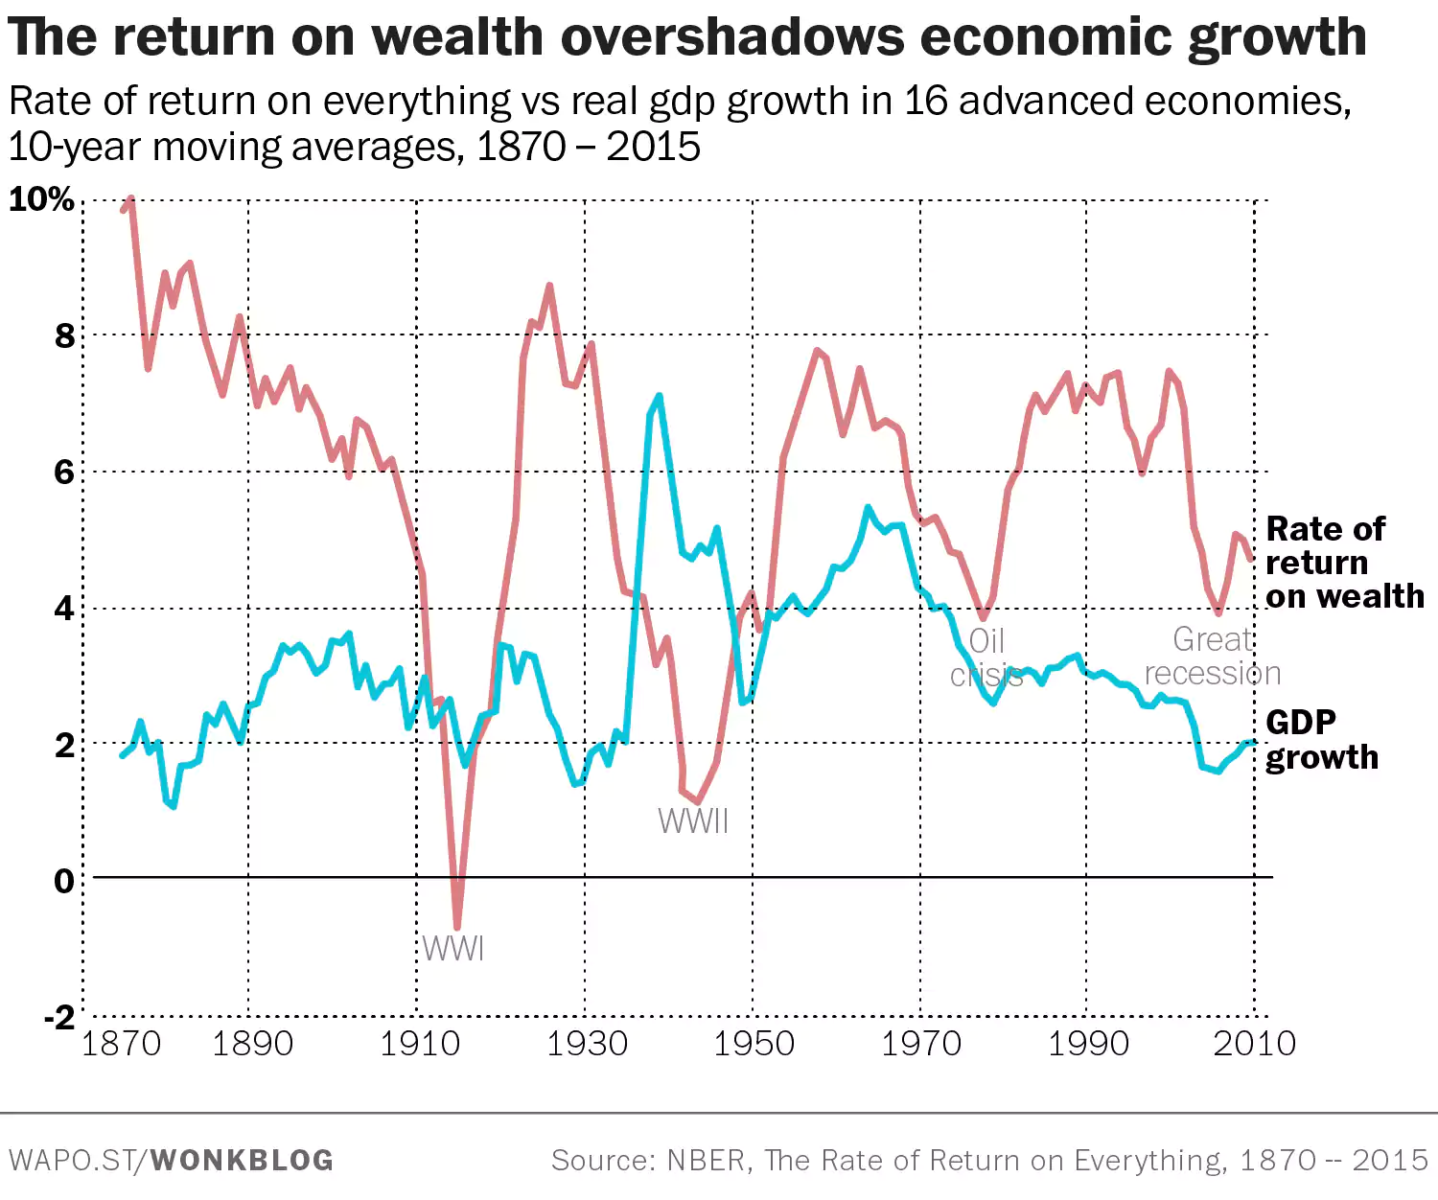
Massive new data set suggests economic inequality is about to get even worse


Worth Reading :
Plse refer to my most recent comments, from 24th May, and 26th April. Things are playing out nicely. This is just a ‘tactical’ update. In my cmmt of the 24th May I set out 2 possible paths for the new bear market we are in, and I want to clarify a little:

1 – 1st, the bigger strategic theme is clear and unchanged – global growth HAS peaked and the deflation trend is clear for the next 3/6mths. This is strategically bullish the USD and USTs (think 1 vs the EURO, and low 2% 10yr yields). And this is strategically BEARISH risk assets (think mid-800s S&P in 3/6mths, and the iTraxx XO index up above 750bps). The strategic asset allocation outlook STRONGLY favours QUALITY as defined by balance sheet strength, balance sheet transparency (which therefore excludes most financials), market position, AND the ability to be a price setter (not taker).
The game changers are: A) a massive turnaround in China towards new stimulus & a new credit creation binge etc – for now very unlikely IMHO; B) a massive turnaround in corporate behaviour resulting in a leverage, capex, investment, hiring & spending binge – extremely unlike for now and for the rest of this yr; C) a new US fiscal package (pretty impossible now), so the most likely and only really viable remaining option is a MASSIVE DEBASEMENT/MONETISATION move led by the Fed (but no doubt globally co-coordinated) thru the announcement of a NEW (say) USD5trn QE package, aided/abetted by maybe another USD5trn of funny money printing by the BoE, the ECB, ther BoJ, the PBOC, the SNB etc etc………HOWEVER, I don’t expect this last bullet to be used until things get REAL UGLY (see above para for levels). If u know u have only 1 bullet left in the rifle – and unless you are amazingly stupid – u don’t try to shoot the charging grizzly bear when its 50 yards away. No, you wait till its 5/10yards away…WHEN we get this final bullet out of the rifle it had BETTER not miss, as if it ‘misses’ we would then have the mother of stagflationnary busts in history where bonds get crushed due to debasement, taking risk assets out with them too. If this is the outcome – and this is really I think a late 2010/2011 story – then trust me, 2008 really will seem like the Good Old Days…..lets hope Uncle Ben not only has the rifle ready, but also that his scope is well lined up and that he has been practising hard… (more…)
 (Reuters) – UBS on Wednesday joined the growing list of brokerages lowering India’s 2011/12 economic growth forecast, paring Asia’s third-largest economy’s growth to 7.7 percent from 8 percent, as interest rate rises and higher oil prices start to bite.
Morgan Stanley and Bank of America-Merrill Lynch had last week lowered their growth forecast for the Indian economy in the next fiscal year that begins in April to 7.7 percent and 8.2 percent.
UBS also cut the world’s second-fastest growing major economy’s gross domestic product forecast for the current fiscal year to 8.7 percent from 9 percent on weak December-quarter growth and continuing weakness in the industrial output growth.
“The reason for the slowdown is as before: lagged impact of todays tight money on demand plus effect of higher oil prices,” Philip Wyatt, an economist at UBS wrote in a note, adding he sees the economy recovering to 8.6 percent growth in 2012/13.
India’s economy grew at a slower-than-expected 8.2 percent in the December quarter from a year earlier, after expanding at 8.9 percent in the previous two quarters.
Industrial output in January topped forecasts, but was still weak at 3.7 percent annual rise.
“We expect WPI (wholesale price index) inflation to accelerate from 7 percent in March 2011 to 7.7 percent a year hence,” Wyatt wrote.
India’s headline inflation unexpectedly quickened in February on rising fuel and manufacturing prices, raising expectations for aggressive central bank tightening beginning later this week. (more…)

There’s been a lot of talk recently about Hungary following in Greece’s footsteps and potentially defaulting on its debt. Bulgaria and Romania are two other weak economies in Eastern Europe, and the chart below shows bank exposure by country to Bulgaria, Romania, Hungary and Greece (source):

It’s interesting to note the exposure that Greece has to Bulgaria and Romania. Romanian and Bulgarian debt comprise more than 25% of the foreign debt that Greek banks hold. Austria also has a high concentration of risk in these four countries, at 29% of total foreign claims outstanding. When investors talk about contagion, what they are really referring to is positive feedback loops. We can see from the chart above how trouble at one country can quickly develop into a concern for other countries. The situation in Greece could make it difficult for Bulgaria and Romania to roll over their debt, an event which would in itself reduce the value of Greece’s assets, creating further difficulty for Bulgaria and Romania.
 WHEN THE Indian Planning Commission finally accepted that the number of people living below the poverty line in India is 37.2 per cent of the total population then most of the people, who have always questioned the government claims of overall growth and development had the last laugh.
Finally the government itself has accepted its failure to bring about an all inclusive development in India. Though from time to time the government spends crores to show the
middle-class Indians that it is doing the best for an all-inclusive growth but in reality still a lot needs to be accomplished to make India a true super power. A country can never rise to upper levels with a massive 37.2 per cent of its population living under the poverty line. One assumes that that is an official and conservative figure. The actual figure will cross 50 per cent quite easily.There are a;sp some allegations that it is pretty easy to get a BPL card in India just by bribing corrupt officials. Such a process deprives the original or genuinely poor Indians from getting their dues. So, the government must do something in order to identify the real persons, who fall in the below poverty line segment. Otherwise, no all-inclusive growth is possible without the correct measure of the real BPL community. Moreover, the various people’s groups must also take some initiatives to force the government to take action against the corrupt officials and make the system clean.
 The BP crisis in the Gulf of Mexico has rightfully been analysed (mostly) from the ecological perspective. People’s lives and livelihoods are in grave danger. But that focus has equally masked something very serious from a financial perspective, in my opinion, that could lead to an acceleration of the crisis brought about by the Lehman implosion.
People are seriously underestimating how much liquidity in the global financial world is dependent on a solvent BP. BP extends credit – through trading and finance. They extend the amounts, quality and duration of credit a bank could only dream of. The Gold community should think about the financial muscle behind a company with 100+ years of proven oil and gas reserves. Think about that in comparison with what a bank, with few tangible assets, (truly, not allegedly) possesses (no wonder they all started trading for a living!). Then think about what happens if BP goes under. This is no bank. With proven reserves and wells in the ground, equity in fields all over the planet, in terms of credit quality and credit provision – nothing can match an oil major. God only knows how many assets around the planet are dependent on credit and finance extended from BP. It is likely to dwarf any banking entity in multiples.
And at the heart of it all are those dreadful OTC derivatives again! Banks try and lean on major oil companies because they have exactly the kind of credit-worthiness that they themselves lack. In fact, major oil companies, conversely, spend large amounts of time both denying Banks credit and trying to get Bank risk off of their books in their trading operations. Oil companies have always mistrusted bank creditworthiness and have largely considered the banking industry a bad financial joke. Banks plead with oil companies to let them trade beyond one year in duration. Banks even used to do losing trades with oil companies simply to get them on their trading register… a foot in the door so that they could subsequently beg for an extension in credit size and duration.
For the banks, all trading was based on what the early derivatives giant, Bankers Trust, named their trading system: RAROC – or, Risk Adjusted Return on Credit. Trading is a function of credit bequeathed, mixed with the risk of the (trading) position. As trading and credit are intertwined, we might do well to remember what might happen to global liquidity and markets if BP suffers what many believe to be its deserved fate of bankruptcy. The Intercontinental Exchange (ICE) has already been and will be further undermined by BP’s distress. They are one of the only “hard asset” entities backing up this so-called exchange.
If BP does go bust (regardless of whether it is deserved), and even if it is just badly wounded and the US entity is allowed to fail, the long-term OTC derivatives in the oil, refined products and natural gas markets that get nullified could be catastrophic. These will kick-back into the banking system. BP is the primary player on the long-end of the energy curve. How exposed are Goldman sub J. Aron, Morgan Stanley and JPM? Probably hugely. Now credit has been cut to BP. Counter-parties will not accept their name beyond one year in duration. This is unheard of. A giant is on the ropes. If he falls, the very earth may shake as he hits the ground. (more…)

Great article if these 10 central banks decide to raise their Gold reserve allocation to 10% Read the full article HERE
 How many flats in China are sitting empty? The media recently floated a story — denied by power companies — that 64.5 million urban electricity meters registered zero consumption over a recent, six-month period. That led to a theory that China has enough empty apartments to house 200 million people.
Statistical transparency is lacking in this area, so the truth about empty apartments remains under wraps. Publishing accurate data should be of the highest priority, since the size of the nation’s unused apartment stock is perhaps the most important measure of the extent and seriousness of China’s property-market bubble. Indeed, it’s a grave concern for policy making, since unpublished data may indicate not only a price bubble but a quantity bubble burdening the market.
Real estate is prone to price bubbles because unique factors restrict its supply response. Inflated prices have been the mark of most modern-day property bubbles. Price bubbles occur frequently and can last a long time.
In the 1980s, Tokyo saw a tremendous rise in property prices not in tandem with supply. The Hong Kong property market experienced a similar phenomenon in the 1990s.
One reason for limited supply is that property development is subject to government regulations, especially local rules. Established communities usually restrict building heights and density, for example, making it virtually impossible for mature communities to increase supply quickly. London, which is now experiencing a price bubble, and Tokyo in the past are cities that tightly control building heights.
Second, infrastructure development takes time and is always relative to land availability. Even in an island-city such as Singapore, land can be reclaimed from the sea at low costs, pointing to the correlation between land and infrastructure. But when property prices are high, and even when money is available for infrastructure development, one should be cautious about plunging in for fear that property prices could later fall. Thus, even over extended periods of time, property supplies may not respond to price increases.
Hong Kong doesn’t have height restrictions like London or Tokyo. Nor does it have infrastructure or land shortages. But a government policy limiting land supply created scarcity before 1997, setting the stage for a bubble. The subsequent catalysts for higher prices were loose monetary conditions imported from the United States through Hong Kong’s currency peg to the dollar. Even though prices were rising, the government chose not to increase supply, leading to a price bubble.
Thus, demand for property also rises under eased monetary conditions, and climbing price momentum attracts speculative demand. If monetary conditions remain loose for a while, credit access can sustain this kind of speculative demand. This points to a need for the Chinese government to adjust its property-market policies as well as interest rates to reduce speculation and steer the market out of a looming bubble crisis.
It’s been said many times that China is experiencing a nationwide urban property price bubble. High prices in major cities where most of the country’s property value is concentrated cannot be explained rationally.
Rising rents are a little easier to explain, however, even in the face of empty flats everywhere. Some blame intermediaries for ramping up the market, but this explanation is hard to stick in China’s fragmented intermediary real-estate industry. Instead, inflation expectation is probably driving current rent increases: Property owners anticipate spending more in the future remodeling flats to compensate for renter wear-and-tear, so they charge higher rents now to plan for higher costs.
What especially distinguishes China’s property bubble, however, is an unprecedented amount of living space. This huge stock of empty flats equals the nation’s quantity bubble.
Quantity bubbles are less common than price bubbles, and they don’t last as long. Rising supply usually exerts downward pressure on prices, although an influx of money can hold up prices even when supply is rising.
A price bubble can damage an economy in three ways. First, it usually leads to a banking crisis. As the market trades at ever-higher prices, buyers borrow more against the same property. Banks that maintain the same lending cushion with, say, a 30% down-payment rule suffer losses when prices fall below that level. A banking system in crisis cannot lend normally, and the economy suffers collateral damage due to dysfunctional banking.
Second, the wealth effect leads to excessive consumption during a bubble. The payback weakens an economy for several years.
And third, bubble-induced demand distorts the supply side. When inflated industries go down with a bubble burst, it takes time for other industries to rise in an economy in their place.
A quantity bubble is sometimes a construction bubble, and it fizzles out when a building cycle turns over, crashing prices as soon as new supply becomes available. This is what happened to a commercial property bubble in the United States in the late 1980s, triggering a bank crisis when it burst and prompting the Federal Reserve to maintain a loose monetary policy that helped the banking system heal.
Quantity and price bubbles may grow together. Southeast Asia, for example, experienced a quantity-cum-price bubble that lasted several years in the 1990s. As regional currencies were pegged to the dollar, loose monetary conditions were imported from the United States, fueling a property bubble. Due to few restrictions on urban development, rising prices led to massive increases in supply. Liquidity inflow fueled speculative demand. But when U.S. monetary policy tightened, the market crashed and triggered the Asian Financial Crisis.
The latest experience in the U.S. market was mainly based on a price bubble, although some cities such as Las Vegas and Miami saw quantity bubbles as well. The U.S. government quickly recapitalized its banking system, limiting the direct effect of the banking crisis on the economy. Current weakness can be explained mainly by the wealth effect and employment losses in bubble-inflated industries.
When Taiwan experienced a price-cum-quantity bubble in the late 1980s, analysts determined the number of empty flats by obtaining electricity meter data from the power supplier, leading many to conclude that about 15% of all flats were empty. Today, some analysts are trying the same tactic in China. But Taiwan’s housing conditions are less complex. Getting to the core of China’s data requires more calculating.
Housing types, for example, must be considered. China’s urban housing stock is mainly split between old, public housing built for company or government employees, and some 60 million units of private housing built over the past 10 years. Property developers are now building about 20 million private flats, and local government-owned land banks may be good for another 20 million to 30 million.
About 1 billion square meters worth of public housing (or about 14 million, 70-square-meter units) have been torn down, leaving about 9 billion square meters of this type of living space nationwide.
Moreover, companies and government agencies are still building apartments for employees. This practice has slowed but remains significant in many cities even today. It’s hard to tell how many of these newer flats are out there.
There are similar unknowns about dormitories, such as factory dormitories that house workers from rural areas who migrate to manufacturing regions. Most of China’s more than 200 million migrant workers may be living in such dormitories.
Not all commercial property is market-driven, since certain people with connections or other advantages may own rental apartments that tend to have high vacancy rates and should be taken into account when calculating market excess.
Another consideration is that massive quantities of housing have been springing up in rural communities near major cities. And when farmland is rezoned for urban development, the region’s housing starts falling into the urban category. (more…)