rss

S&P and Dow close higher for the 6th consecutive day

NASDAQ 7-day win streak broken today

The S&P squeaked out a higher close. The Dow industrial average also closed higher. The gains for the day extended the up streak to 6 consecutive days. The NASDAQ index streak of 7 consecutive higher closes was broken as it fell close to 1% on the day.

A look at the final numbers shows:
  • S&P index rose 2.12 points or 0.06% to 3351.532
  • NASDAQ index closed down 97.09 points or -0.87% to 11010.98
  • Dow industrial average closed up 47.74 points or 0.17% to 27434.72
The Dow had his best week since June 5.. The S&P index at its best week since July 2.
For the week the major indices close higher with the Dow leading the way with a 3.81% increase.
The change for the 1st week of August is showing:
  • S&P index, +2.45%
  • NASDAQ index, +2.47%
  • Dow industrial average +3.8%
Year-to-date, the Dow is within 3.87% of unchanged for the year.
  • S&P index is up +3.73%
  • NASDAQ index is up and oversized +22.72%
  • Dow industrial average is down -3.87%
Winners today included:
  • First Solar, +13.08%
  • FedEx, +6.57%
  • Marriott international, +3.77%
  • Wells Fargo, +3.47%
  • American Express, +3.46%
  • Travelers, +3.17%
  • Charles Schwab, +2.72%
  • PNC financial, +2.58%
  • General Dynamics, +2.57%
  • Bank of America +2.47%
  • Citigroup, +2.42%
  • Raytheon technologies, +2.29%
  • J.P. Morgan, +2.2%
  • Berkshire Hathaway, +2.11%. Berkshire Hathaway will announce their earnings tomorrow
Big decliners today included:
  • Tencent, -7.36%
  • Lyft, -6.65%
  • Uber, -5.21%
  • AliBaba, -5.08%
  • Slack, -3.76%
  • Zoom, -3.55%
  • Chewy, -3.23%
  • Adobe, -3.19%
  • Netflix, -2.77%
  • PayPal, -2.63%
  • Qualcomm, -2.53%
  • Tesla, -2.44%
  • Apple, -2.28%
European shares closed mixed led by the German DAX which rose by 0.66%. Spain’s Ibex fell by -0.11%.

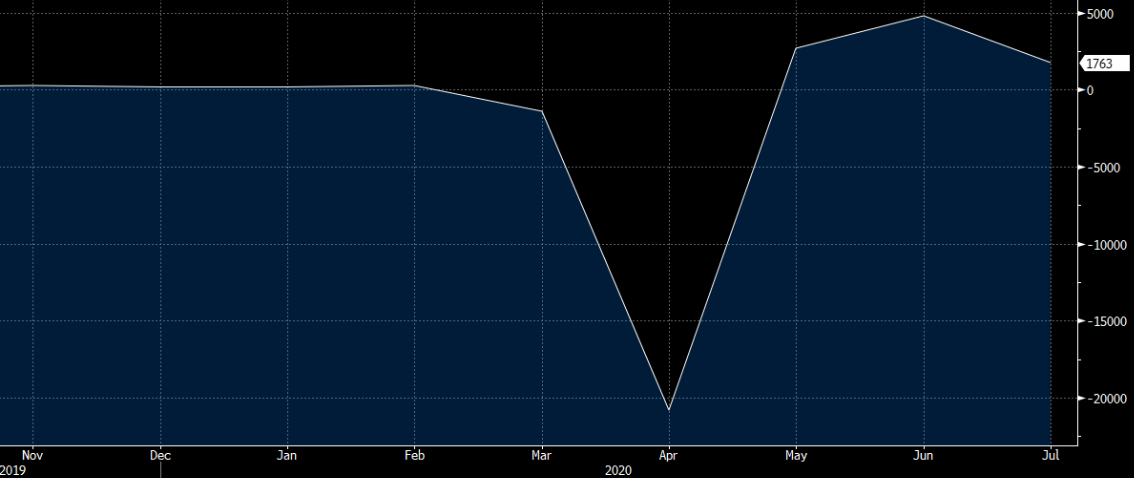
US July non-farm payrolls +1763K vs +1480K expected

US July 2020 non-farm payrolls data

nonfarm payrolls chart
  • Prior was +4800K (revised to 4791K)
  • Two month net revision +17K
  • Change in private payrolls +1462K vs +1200K expected
  • Change in manufacturing payrolls +26K vs +255K expected
  • Unemployment rate 10.2% vs 10.6% expected
  • Adjusted for misclassification 11.1%
  • Prior unemployment rate 11.1%
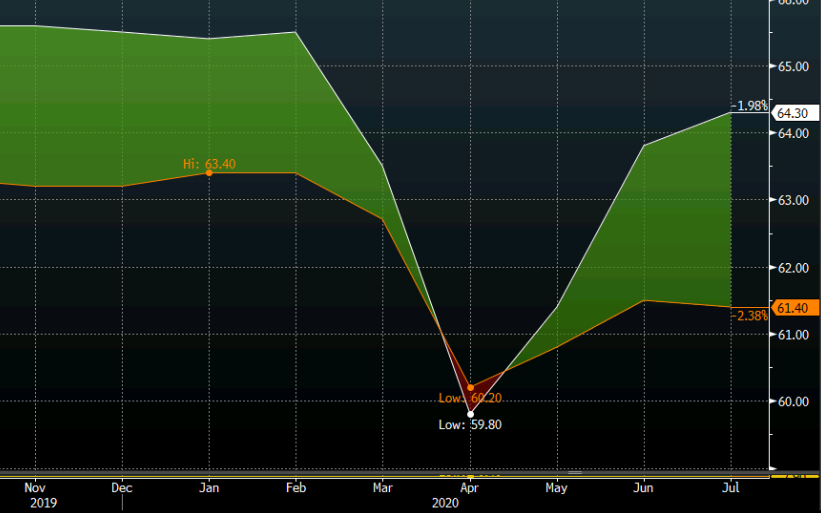
  • Participation rate 61.4% vs 61.8% expected
  • Prior participation rate 61.5%
  • Underemployment rate 16.5% vs 18.0% prior
  • Average hourly earnings +0.2% m/m vs -0.5% expected
  • Average hourly earnings +4.8%% y/y vs +4.2% expected
  • Average weekly hours 34.5 vs 34.4 expected
  • Employment in the household survey +1.4m
  • Part time jobs +803K
  • Full time jobs little changed
  • Full report
I noted before the report that a seasonal adjustment quirk was likely to add nearly 1m jobs to payrolls. It only added 245K jobs. From the BLS:
Government employment rose by 301,000 in July but is 1.1 million below its February level. Typically, public-sector education employment declines in July (before seasonal adjustment). However, employment declines occurred earlier than usual this year due to the pandemic, resulting in unusually large July increases in local government education (+215,000) and state government education (+30,000) after seasonal adjustment.
However it was even stronger than that and the majority of it was in private payrolls. The unemployment rate was also better but you can discount most of that because of a dip in participation rather than the rise expected.
Looking at the US and Canadian jobs data together, one thing that caught my attention is the growing gap in labor force participation. The Canadian participation rate now 1.2 pp below Feb levels while US 1.9 pp lower. I would have expected it the other way around with more of Canada shut in July. That will be something to watch in the months ahead.
US vs Canada participation rate

Crude oil inventories for July 31 -7.373M vs -3.335 est.

Crude oil inventories for July 31

  • crude oil inventories -7.373M vs -3350M estimate. The drawdown is a little lower than the 8.587 from the private data last night
  • gasoline 0.419 million vs. -0.500M estimate
  • distillates 1.591M vs 0.986M estimate
  • Cushing 0.532M vs 1.309M last week
  • crude oil implied demand 18063 vs. 17762 last week
  • gasoline implied demand 9386.6 vs. 9250.1 last week
  • distillates implied demand 4812.7 vs. 4859.1 last week
  • US refinery utilization 0.10% vs. 0.20% estimate. Last week 1.6%
The price of crude oil after a brief dip is back trading near high levels for the day at $43.41. That’s up $1.71 or 4.12%. The high for the day reached $43.52. The 200 day moving average is currently at $43.92. The price of the September contract is not traded above its 200 day

The weekly oil inventory data is due out at the bottom of the hour

Private data last night showed a bigger than expected drawdown of crude inventories

The Department of Energy will release their weekly inventory data.

The private API numbers from last night showed:
  • crude oil -8.587M vs -3.35M est.
  • gasoline -1.748M vs -1.3M estimate
  • distillates +3.824M vs +100K est
  • Cushing +1.63M
The price of September WTI crude oil futures are up $1.68 or 4.03% at $43.39. The price shot through the 50% retracement of the 2020 move lower at $41.71.  The contracts 200 day moving average is at $43.92. The high price today has reached $43.52

Major indices close higher. The NASDAQ closes at a new record high again

Late day rally takes the indices to new session highs

the major indices rallied into the close and as a result are closing near/at their highs for the day. The Dow industrial average led the way today with a 0.62% gain. The S&P index and NASDAQ index each closed up around 0.35%.

  • The NASDAQ closed at yet another new record high and have been up for 5 consecutive days. For the year the NASDAQ is up 21.8%
  • The S&P closes lesson 3% from the all-time high
  • The S&P index and Dow industrial average have now been up for 3 consecutive days
The final numbers are showing:
  • S&P index rose 11.9 points or 0.36% at 3306.51. The close was just off the session highs at 3306.84. The low reached 3286.37
  • NASDAQ index rose 38.37 points or 0.35% at 10941.16. The high price reached 10941.90. The low extended to 10852.89
  • Dow industrial average rose 164.07 points or 0.62% at 26828.42. It’s high price reached 26832.72. The low price extended to 26597.82
Although there is no coronavirus deal, just before the close Senate Majority Leader Mitch McConnell said he could support an extension of the US$600 unemployment benefit it Trump supports it.
After the close Disney reported adjusted earnings-per-share of $0.08 vs. expectations of $-0.64. The revenues however came in light at $11.78 billion vs. expectations of $12.39 billion. Disney plus subscribers told 57.5 million vs. expectations of 59.4 million. Disney shares initially move lower but are now trading up 2.46% $120.18.

Pelosi confirms US coronavirus economic rescue package talks to continue Tuesday

  • U.S. House Speaker Nancy Pelosi

  • Treasury Secretary Steven Mnuchin
  • White House Chief of Staff Mark Meadows
will meet again on Tuesday for further talks on the next around of coronavirus economic aid.
Pelosi said the talks Monday had been productive

Japan final Q1 GDP -0.6% q/q

January to March economic growth data from Japan. Old, old news by now.

  • GDP sa q/q -0.6%, prior -0.6%
  • GDP annualised sa q/q -2.2%, prior -2.2%
  • GDP nominal q/q -0.5%, prior %
  • Private consumption -0.8% q/q, prior -0.8%
  • Business spending +1.7%, prior +1.9%

Yen unchanged.

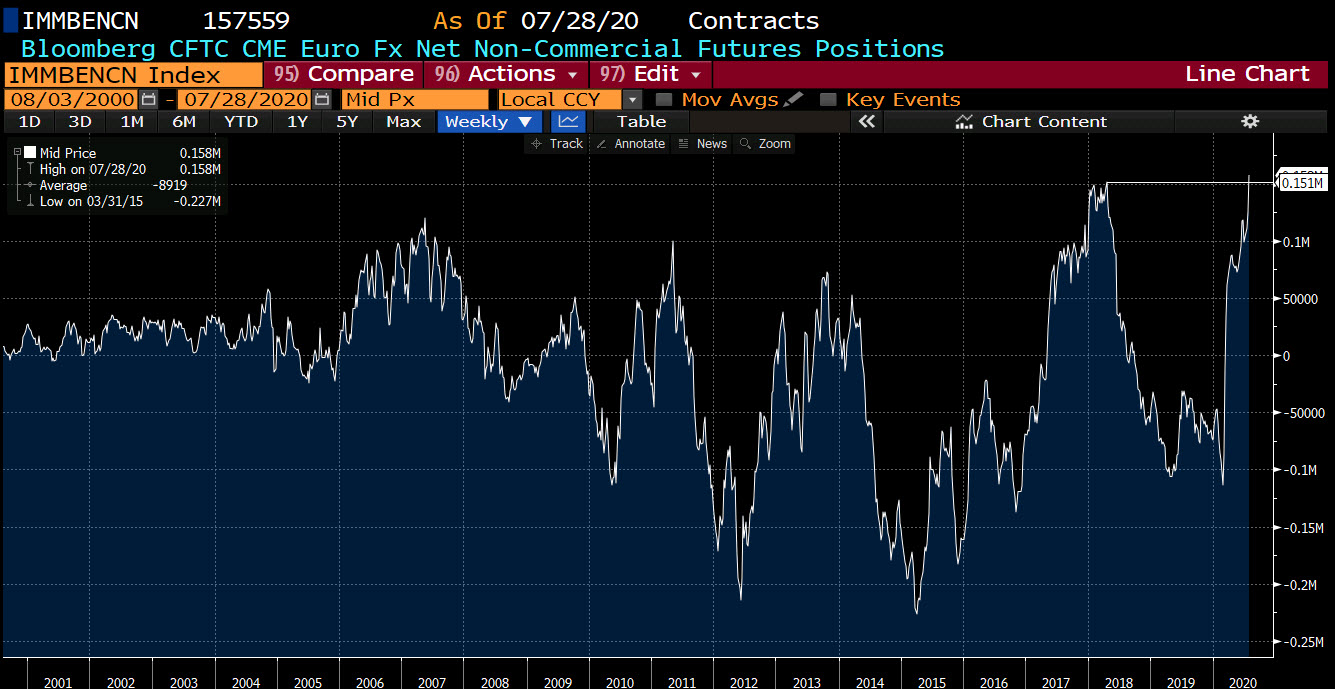
CFTC commitments of traders: EUR longs spike by 32K to a record long level

Weekly FX speculative positioning data from the CFTC


  • EUR long 157K vs 125K long last week. Longs increased by 32K
  • GBP short 25K vs 15K short last week. Shorts increased by 10K
  • JPY long 29K vs 19K long last week. Longs increased by 10K
  • CHF long 8K vs 7K long last week. Longs increase by 1K
  • AUD short 5K vs 0K long last week. Shorts increased by 5K
  • NZD short 1K vs 2K last week. NZD switches from long to short. 3K change
  • CAD short 13k vs 17K short last week. Shorts trimmed by 4K
Highlights:
The BIG HIGHLIGHT for the week is in the EUR.  The EUR longs spiked up by 32K to 157K in the current week to a record high for long positions. The move higher is corresponding to higher EURUSD prices. The price of the EURUSD has been up for 6 consecutive weeks.  The long position started to move more to the upside during the May 19 week when the position was at 72K.  The EURUSD during that week was down at 1.0800. The price high today reached to 1.1908 before backing off.  Nice trade for the longs.
Of course, a concern for markets that get too long or short, is that there can be a squeeze the other way if prices start to lose trend momentum.   As a result, be careful of too much of a good thing, but let the technicals tell the story. They have been bullish.
Weekly FX speculative positioning data from the CFTC_
The GBP shorts, however, increased by 10K to 25K (still much lower than the EUR longs) while the currency has moved higher.
The JPY longs increased and the USDJPY moved down (higher JPY) into early trading today. However, the price snapped back higher and nearly erased the full move lower this week in a single day.

Major indices close higher and at session highs. NASDAQ leads the way with Apple, Facebook, Amazon outperforming

Dow, S&P, NASDAQ close higher for the 4th consecutive month

the month of July is over and all the major indices closed higher for the 4th consecutive month. The S&P index had its second-best July performance since 2010. Apple, Amazon, Facebook all of the way after their earnings release last night. Apple rose up 10.47%. Facebook rose 8.18% and Amazon rose by 3.7%.  Alphabet was left out despite posting better earnings. Their stock fell by -3.28%.

On the downside the Dow post its 2nd straight weekly decline.
The final numbers are showing:
  • S&P index up 24.9 points or 0.77% at 3271.12
  • NASDAQ index up 157.46 points or 1.49% at 10745.23
  • Dow industrial average up 114.67 points or 0.44% at 26428.33
For the week, the NASDAQ led the way. The Dow industrial average could not make it to the unchanged level falling by -0.16%:
  • S&P index rose by 1.73%
  • NASDAQ rose by 3.69%, and as mentioned
  • Dow fell by -0.16%
For the month, the market initially tried to rotate out of the NASDAQ stocks and into the industrial/broader market, but the run up in tech stocks today and this week push the NASDAQ back into the lead:
  • S&P index rose by 5.51%.  As mentioned it was the 2nd largest July increase since 2010
  • NASDAQ index rose by 6.82%
  • Dow rose by 2.3%
For the year to date, the Nasdaq index continues to outperform, but the S&P index has moved back into the black (it dipped into the red earlier this week). The Dow remains lower on the year.
  • S&P index up 1.25%
  • Nasdaq up 19.76%
  • Dow down -7.39%

European indices end the day in the red

Indices close near lows for the day

The European indices are ending the day lower and also closing near the lows for the day.
The provisional closes are showing:
  • German DAX, -0.5%
  • France’s CAC, -1.4%
  • UK’s FTSE 100, -1.1%
  • Spain’s Ibex, -1.7%
  • Italy’s FTSE MIB, -0.7%
For the week, the indices are down sharply:
  • German DAX -4.0%
  • France’s CAC -3.49%
  • UK’s FTSE 100, -3.25%
  • Spain’s Ibex, -5.7%
  • Italy’s FTSE MIB, -4.9%
For the month, the German DAX closed near unchanged. The other indices were lower:
  • German DAX, unchanged
  • France’s CAC, -3.1%
  • UK’s FTSE 100, -4%
  • Spain’s Ibex, -4.9%
  • Italy’s FTSE MIB, -1.46%

In the benchmark 10 year yields today, yields have moved back higher after being negative at the start of the North American session

Indices close near lows for the day
Go to top