rss

Another sharp day down in the major US indices

Yields fall to new lows

The risk off flows continued in the US stock market and debt market.
The Dow industrial average was down over 1000 points at 1 point during the day. The S&P index fell below the 3000 level briefly before rebounding in the last hour of trading.
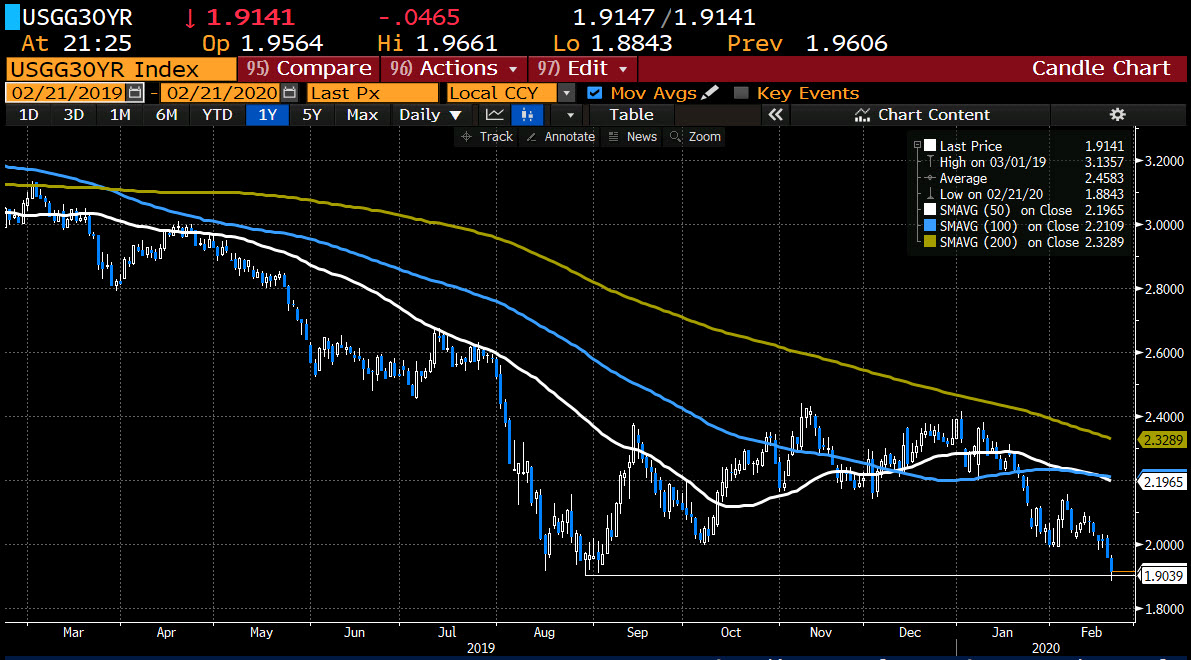
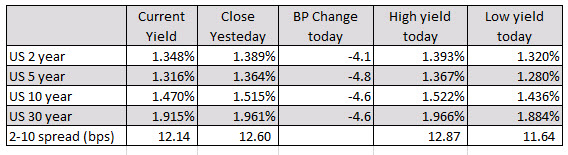
In the US debt market yields resumed their downward bias after yesterdays modest rebound.
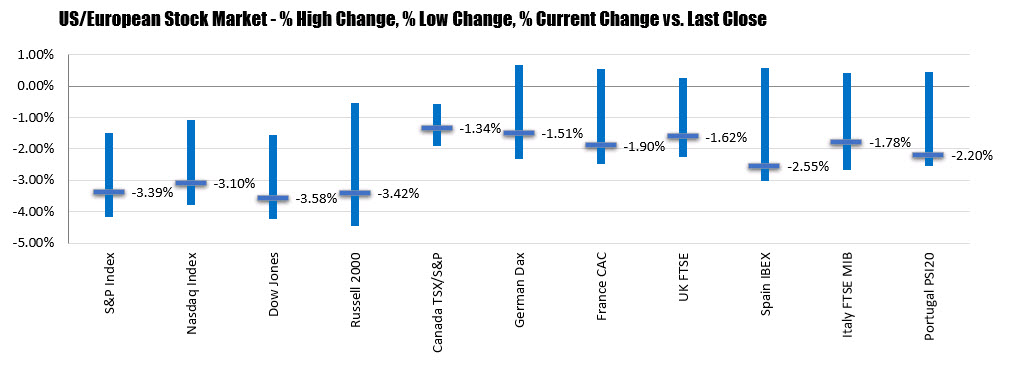
The final numbers for the major indices are showing:
  • S&P index -106.18 points or -3.39% at 3023.94. The low price extended to 2999.83. The high was up at 3083.04
  • NASDAQ index fell -279.49 points or -3.10% at 8738.59. The low price reached 8677.387. The high price extended to 8921.078
  • Dow industrial average fell minus this 969.58 points or -3.58% at 26121.28. The low price extended to 25943.33. The high price reached 26671.92
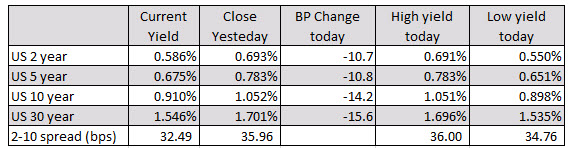
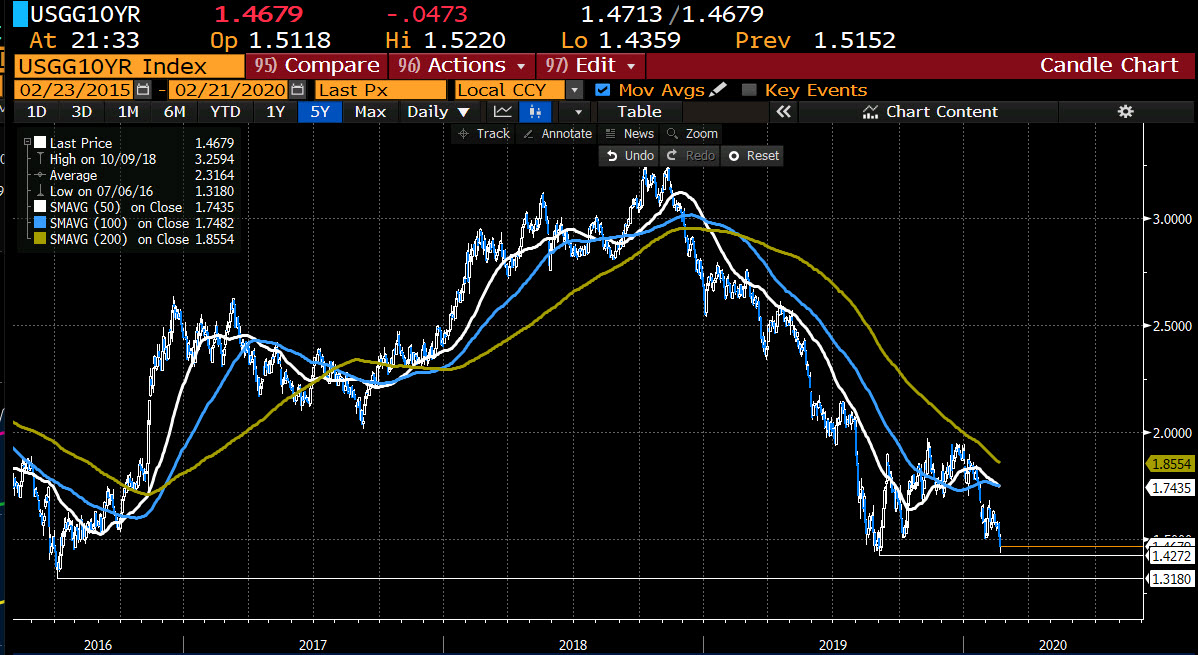
In the US debt market the 10 year yield fell to a new record low level of 0.898%. It is currently trading at 0.91%. That is still down -14.2 basis points on the day. The yield curve flattening a bit to 32.49 basis points from close to 36 basis points the close yesterday, but all maturity levels fell by over -10 basis points.

US yields tumbled lower

30 year yield falls to a new all time low

The headline of the day is that the 30 year yield traded to a new all time low of 1.8843%. That took out the August 2019 low yield of 1.9039% and although the yield is closing above that old low, the closing level will be the lowest on record.

Forex news for NY trading on February 21, 2020

Helping the yields move lower is the:

  • Expectation of a cut in US rates by July and potential for another cut later in the year
  • Flight to safety flows
  • Lower global growth from the coronavirus
  • Dollar buying as the US remains a safe haven
  • The Markit Service and Composite PMI data was below the 50.0 level while the manufacturing index was lower than expectations as well.
The 10 year yield also moved lower and approached the swing low from 2019 at 1.4272%. The low yield today reached 1.4359% before rebounding into the close to 1.4700%.  The all time low yield was in 2016 at 1.3180% (see chart below).
The 10 year yield fell below support at 1.50% and looks toward the 2019 low yield at 1.4272%
Below is a table of the current, high and low yields for the US debt along the yield curve.   The 2-10 year spread also flattened to 12.14 basis points from 12.60 basis points yesterday.
The US yields are moving lower.  US stocks today fell with the Nasdaq leading the way down. For the day, the Nasdaq fell -1.79% after being down as much as 2.14% at the low. The S&P index closed down a more modest -1.05% after falling as much as -1.33%.   For the week, the major indices fell with the Dow down -1.46%, the S&P down -1.07% and the Nasdaq index down -1.39%.
Gold was another big mover today and this week. The price of gold is trading up $24.00 or 1.48% at $1643.43. The high for the day reached $1649.26. That was the highest level since February 2013. For the week, the price of gold settled last Friday at $1584. The current price at $1643.43 is a $59.43 gain for the week or 3.75% gain.   Big breakout move for gold this week.
Gold moved up nearly $60 this week
The fall in stocks, rise in gold, fall in yields led to a fall in the USD today. The USD was the weakest of the major currencies today. The strongest currency was the GBP (but it came off the highs in the NY session).   The dollar fell by 0.61% vs the GBP. It also fell versus the EUR by -.59% vs the EUR and -0.58% vs the CHF.

Process Versus Outcome in Trading

248823-2163-0This concept of process versus outcome was first introduced to me when I read the book, “More Than You Know”, by Michael Mauboussin. It was also discussed in the books written by the brilliant authors Michael Covel and Mark Douglas.
The best way to explain the concept is using the following examples, which involves the game black jack (the only card game I know).
1) Good Process/Good Outcome
The cards you are dealt add up to 12. You have the choice to stay or hit. You chose to hit and receive a 9-blackjack.
The equivalent scenario, in my view, in the stock market is that you see a stock in a downtrend, so, following your rules, you short it. The stock ends up falling another 40% before turning around.
2) Good Process/Bad Outcome
The cards you are dealt add up to 12. You have the choice to stay or hit. You chose to hit and you get a 10 -bust.
In the stock market this is comparable to buying a stock that is in an uptrend, (more…)

Trending Value Metrics by O’Shaughnessy

James O’Shaughnessy is a well known “value quant” for his book What Works on Wall Street (4th Ed). He has a new column in Marketwatch discussing what he calls  “the top stock-market strategy of the past 50 years.”

According to Jim, using a combination of value and momentum strategies — “Trending Value” — is the best performing strategy since 1963. To capture this, he ranks stocks based on:

• Price-to-Sales
• Price-to-Earnings
• Price-to-Book
• Price-to-Cash Flow
• EBITDA/Enterprise Value
• Shareholder yield (dividend yield + rate of share repurchases)

O’Shaughnessy ranks all of these on a 1-100 basis for his Trending Value portfolio. He works with the top 10% of those ranked stocks with the best composite score. He selects a concentrated portfolio of 25 stocks based on trailing six-month momentum, creating an extremely cheap group of stocks that are on the mend.

Its an interesting ideas, one worth exploring . . .

Go to top