rss

Baker Hughes oil rigs 183 vs. 172 last week

Total rig counts up to 254 from 244 last week

In a surprise, the Baker Hughes rig counts moved higher this week.

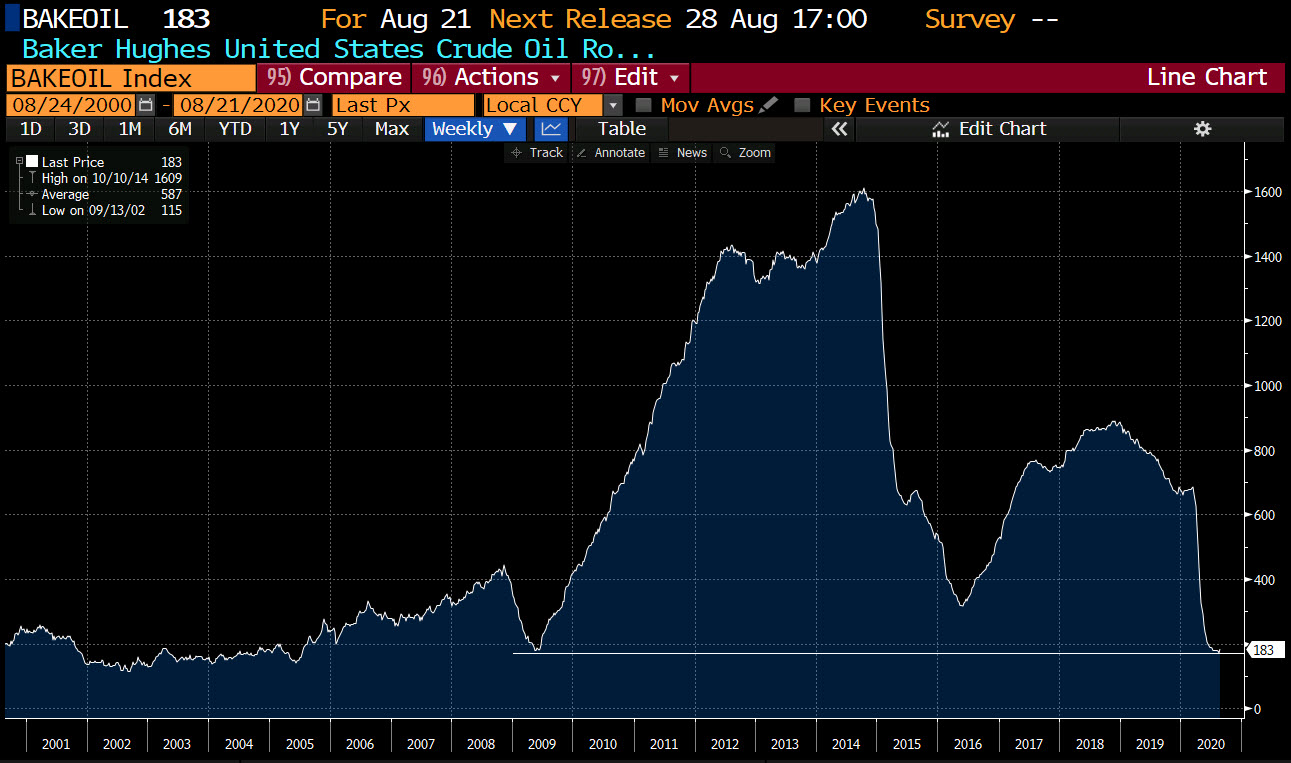
  • Total rigs moved to 254 from 244 last week. This is the 1st increase in 24 weeks.
  • Oil rigs rose by 11 to 183 from 172 last week. This is the largest weekly gain since January
  • Gas rigs fell by 1 on the week to 69 from 70 last week
The oil rigs reached the lowest level since 2005 last week. The move up to 183 is the highest since July 3 when rigs came in at 185.
Oil rigs
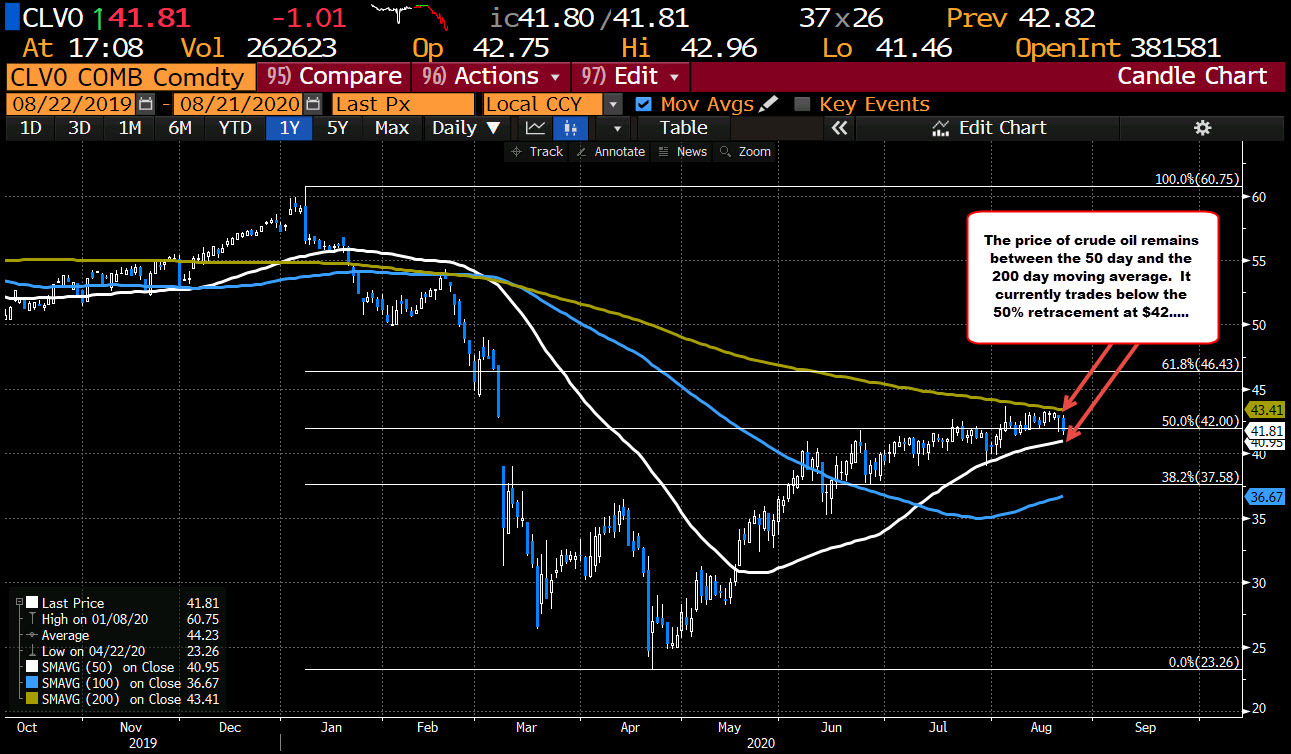
Crude oil is trading at $41.65 for the October contract. That is little changed to the pre-release level.
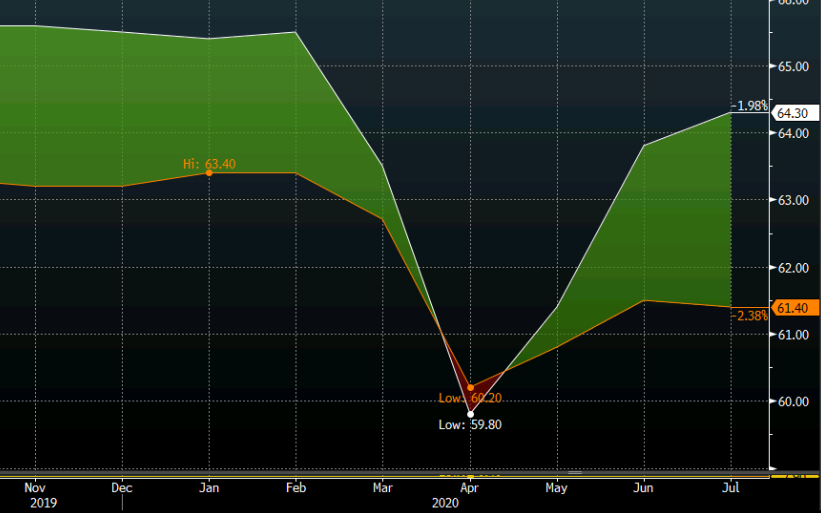
Looking at the daily chart below, the contract remains above its 50 day average at $40.95 (white moving average line in the chart below) and below its 200 day moving average of $43.41. The range since August 6 as a low $41.33 and a high of $43.29. The low today reached $41.46 just above the low of that range.
In between the moving averages sits the 50% retracement of the 2020 trading range which comes in at even $42. As I type, the price has moved higher and currently trades at $42 – right at that 50% level. Get above and we could see further upside momentum.
At some point, the ups and downs will cease and we will get a break. The moving averages will represent key breakpoints. Focus on those levels.
Crude oil prices for the October contract

Why the US dollar continues to rebound and what’s next

The pressure is on

Dollar
The US dollar has extended its gains as market participants get caught wrong-footed in a rebound after multi-month lows.
The dollar looked to be breaking down yesterday and today but stabled itself and is making a move to the upside. There are two near term factors to watch:
1) The 20-year auction
The US is selling $25B in 20-year bonds at the top of the hour. Last week there was a strong 10-year sale and a very weak 30-year sale so the bond market is off balance. A higher-than-anticipted yield could boost the dollar further.
2) The FOMC minutes
The Fed is a below-the-radar risk at the moment. The strong belief in markets is that they’re creeping towards doing more for the economy but an improvement in US virus cases, decent economic data, higher inflation and the stock market at record highs might make them slow their roll. If so, the dollar could climb further
Overall, this looks like a position-squaring squeeze in a quiet mid-August market to me but you can’t take anything for granted. If it spills over into a broad risk-off move, then the dollar could have a lot of room to run.
The EUR/USD chart to me looks like a retest of the range break before a further breakout but a close over 1.19 today would add confidence.
EURUSD chart

FOMC meeting minutes, what to expect later?

Likely more noise more than anything else

Fed

The market will be keenly eyeing the release of the July FOMC meeting minutes later today but it is unlikely to tell us much that we don’t already know at the moment.

The Fed has acknowledged that the economic situation is starting to worsen a little and cast a bit of a dark cloud over the outlook in 2H 2020, considering the fact that the virus situation was escalating rather rapidly across the US last month.
If anything, I would say the minutes should just reaffirm that sentiment and also highlight that the Fed will still do whatever it takes to bolster the economy.
Other than that, there may be room to look out for potential policy changes/tweaks – possibly on future communication – but that is unlikely to offer much as the longer-term plan remains in tact (still just be mindful of this space in any case).
While the market may be looking to the minutes for further suggestions, it is not likely to change the themes that we have been seeing so far to start the week.
The softer outlook may be a signal for equities to pause after hitting all-time highs but for the dollar, election uncertainty and the stalemate on stimulus talks have been factors that are weighing on the currency; and those won’t be going away.
The dollar gave up on some key technical levels in trading yesterday but amid a tricky August so far, let’s see if sellers have the conviction to follow through ahead of the weekend.

Bank of Japan refuses trader requests to work from home

Bloomberg had this piece up earlier (link for more), citing ‘people familiar:

  • The BOJ doesn’t allow home computers to connect to its network for conducting asset purchases and other market transactions
  • Three firms (at least) have asked the BOJ whether traders can participate in its operations from outside the office
  • BOJ-Net infrastructure is used for yen transactions daily, connected via dedicated cables to computers at dozens of financial firms so they can trade assets with the central bank or buy bonds from the government
  • BOJ is concerned about cybersecurity risk.
The hot new toy for summer probably won’t be keenly sought after amongst BOJ counterparties:
Bloomberg had this piece up earlier (link for more), citing 'people familiar:

Dollar reverses its course

Seeing some dollar buying all of the sudden

The dollar has reversed back higher in the last 30 minutes of trading.
Seeing some dollar buying all of the sudden
The EURUSD is back down testing the trend line on the 5 minute chart. The 100 bar MA on the same chart has been broken, but the trend line continues to hold the support.
GBPUSD
The GBPUSD has moved down to test its 100 bar MA on the 5 minute at 1.30904 but is finding some support as well. It will take a move below to swing more of the bias back to the downside.

US weekly initial jobless claims 963K vs 1100K expected

Claims fall below 1 million

weekly initial jobless claims
  • Prior was 1186K (revised to 1191K)
  • Continuing claims 15486K vs 15800K expected
  • Prior continuing claims 16090K
  • PUA claims 489K vs 656K prior
  • Full report
The total number of people claiming benefits for all programs was 28,257,995, down 3065K from the prior week.
This was the first time initial jobless claims were below 1 million in 21 weeks.

India reports record daily new coronavirus cases of 66,999 in latest update today

That brings the total confirmed cases in the country to nearly 2.4 million

India is among the countries that have been hit the hardest by the pandemic as the struggle to balance between the health crisis and the economic fallout is particularly stark.

As for the health crisis, the bright side is that over 1.6 million of those infected has recovered from the disease. However, the spread is still outpacing the number of recoveries:
India
At the start of July, India reported ~220,000 active cases in the country. That figure is now ~643,000. The only positive – if you really want to look at it that way – is that the mortality sits at just ~1.9%. That is better than the ~3.2% seen in Brazil and the US.
In the bigger picture, as long as the health crisis worsens in India, it will have an impact on the global economic situation in general. Before the pandemic, there have been talks that India’s share of global growth might rival that of US, China in the next decade.
They were already among the top five – some would argue top three – contributors of global growth over the past few years, so any major setback to India will also be a setback for the global economy in that sense.

This is what gold fever looks like

Hungry for gold news?

Hungry for gold news?  
Last week I made one comment that submitted to one media outlet on gold prices. The take up was telling.
The below was the amount of publications it occurred in and the approximate circulation.
Remember the below came from just one comment.
This is what a mania market looks like.
Gold is buy on the dips and buy on the breakouts. If you could only trade one market this year – this would be it. 

US July non-farm payrolls +1763K vs +1480K expected

US July 2020 non-farm payrolls data

nonfarm payrolls chart
  • Prior was +4800K (revised to 4791K)
  • Two month net revision +17K
  • Change in private payrolls +1462K vs +1200K expected
  • Change in manufacturing payrolls +26K vs +255K expected
  • Unemployment rate 10.2% vs 10.6% expected
  • Adjusted for misclassification 11.1%
  • Prior unemployment rate 11.1%
  • Participation rate 61.4% vs 61.8% expected
  • Prior participation rate 61.5%
  • Underemployment rate 16.5% vs 18.0% prior
  • Average hourly earnings +0.2% m/m vs -0.5% expected
  • Average hourly earnings +4.8%% y/y vs +4.2% expected
  • Average weekly hours 34.5 vs 34.4 expected
  • Employment in the household survey +1.4m
  • Part time jobs +803K
  • Full time jobs little changed
  • Full report
I noted before the report that a seasonal adjustment quirk was likely to add nearly 1m jobs to payrolls. It only added 245K jobs. From the BLS:
Government employment rose by 301,000 in July but is 1.1 million below its February level. Typically, public-sector education employment declines in July (before seasonal adjustment). However, employment declines occurred earlier than usual this year due to the pandemic, resulting in unusually large July increases in local government education (+215,000) and state government education (+30,000) after seasonal adjustment.
However it was even stronger than that and the majority of it was in private payrolls. The unemployment rate was also better but you can discount most of that because of a dip in participation rather than the rise expected.
Looking at the US and Canadian jobs data together, one thing that caught my attention is the growing gap in labor force participation. The Canadian participation rate now 1.2 pp below Feb levels while US 1.9 pp lower. I would have expected it the other way around with more of Canada shut in July. That will be something to watch in the months ahead.
US vs Canada participation rate

Non-farm payrolls preview: Half the expected jobs gain in July are because of a quirk in seasonal adjustments

Teaching jobs are a big quirk

The consensus for Friday’s non-farm payrolls report is for 1.5 million jobs gains in the month but that doesn’t tell the real story.
The ADP report this week got some attention because it showed private hiring at just 167,000 jobs. Normally, you would expect that to take a big bite out of expectations, but it hasn’t.
Why? A big reason is seasonal adjustments in the data.
Normally, one of the easiest and clearest seasonal adjustments is teachers. They’re laid off at the same time every year and hired at the same time every year. So you discount the lay offs in June/July and the hires in Aug/Sept. It all washes out.
This year though, teachers were laid off early — in April, May and June.
In the BLS model, most of those layoffs are supposed to happen in July. So what happens is they add nearly 1 million jobs to the total before they even start counting. The thing is, those layoffs haven’t happened this year.
teacher
Because of that effect, job losses were overestimated in April/May and now will be added back in July. They estimate the effect at +850K jobs.
Still, that number could be fluid and the assumptions and adjustments the BLS makes will be critical in how it turns out. The risk is that it shows a skewed picture.
Given that, the better spot to watch may be the unemployment rate, which is taken from the household survey. This has its own problems because many people laid off because of COVID-19 have been misclassified — a problem the BLS has been struggling to correct. The consensus there is an improvement to 11.2% from 12.3%. Private payrolls (consensus +1398K) could also offer a clearer look at the economy excluding teacher effects.
As for trading it, watch out for people pointing to the seasonal adjustment effect after the fact. But note that it should already be priced in.
Go to top