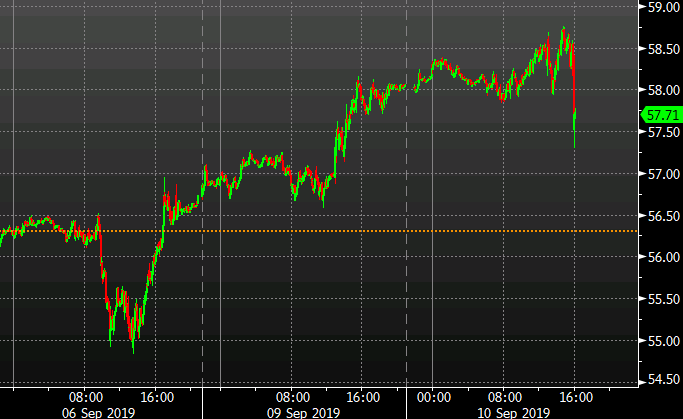
rss

CFTC Commitments of Traders: Euro shorts continue to build

Weekly FX futures positioning data from the CFTC for the week ending Feb 11, 2020:

  • EUR short 86K vs 75K short last week. Shorts increased by 11K
  • GBP long 21K vs 13K long last week. Longs increased by 8K
  • JPY short 26K vs 21K short last week. Shorts increased by 5k
  • CHF long 4K vs 5K long last week. Longs decreased by 1K
  • AUD short 33k vs 43K short last week. Shorts decreased by 10K
  • NZD short 4K vs 2K short last week. Shorts increased by 2K
  • CAD long 10k vs 19K long last week. Longs decreased by 9K

CFTC commitments of traders: EUR shorts increase.

Weekly FX futures positioning data from the CFTC

  • EUR short 59K vs 47K short last week. Shorts increased by 12K
  • GBP long 18K vs 25K long last week. Longs decreased by 7K
  • JPY short 36K vs 45K short last week. Shorts increased by 9k
  • CHF loan 3.5K vs 1.5 long last week. Longs increased by 2K
  • AUD short 27k vs 19K short last week. Shorts increased by 8K
  • NZD long 2K vs 1.8K longlast week. Longs increased by 0.2K
  • CAD long 35k vs 38K long last week. Longs decreased by 3K

Highlights:

  • EUR shorts had the biggest change in week (increase of 12K to the short side).
  • The EUR short 59K is the largest speculative position
  • JPY shorts trimmed. I have to think that there might be more liquidation over the last few days on the back of the coronavirus.
Below is the history of the EUR. It has been negative since the 1st week of October 2018.
Weekly FX futures positioning data from the CFTC_

CFTC Commitments of traders: JPY shorts increase to largest level since early December

Weekly FX futures positioning data from the CFTC

  • EUR short 47K vs 48K short last week. Shorts trimmed by 1K
  • GBP long 25K vs 31K long last week. Longs increased by 6K
  • JPY short 45K vs 31K short last week. Shorts increased by 14k
  • CHF 1.5K vs flat last week. Longs increased by 1.5K
  • AUD short 19k vs 20K short last week. Shorts trimmed by 1K
  • NZD long 1.8K vs square last week. Longs increased by 1.8K
  • CAD long 38k vs 33K long last week. Longs increased by 5K

Weekly FX futures positioning data from the CFTC

WTI crude oil futures settle at $58.43

Plus $2.33 or 4.1%

The price of WTI crude oil futures are settling at $58.43. That is a gain of $2.33 or 4.1%. The move higher today was helped by a bigger than expected drawdown of inventories of -4856K versus -1500K estimate.  News that Saudi Arabia is is threatening to keep production higher to punish producers who don’t keep to their quotas had little impact.
Plus $2.33 or 4.1%
Looking at the 60 minute chart above, the contract spiked above its 100 hour and 200 hour moving averages (blue and green lines) and extended up to the recent highs over the last 9 or so trading days between $58.67 and $58.74. The high price today reached $58.66. The low for the day was down at $56.28.
A move above this ceiling would be more bullish for the contract. Staying below, and we could see a rotation back down toward the 200 hour moving average of $57.46.

CFTC Commitments of Traders: Pound shorts haven’t been squeezed…yet

Forex futures positioning data from the CFTC for the week ending October 15, 2019:

Forex futures positioning data from the CFTC for the week ending October 15, 2019:
  • EUR short 75K vs 75K short last week. Unchanged
  • GBP short 73K vs 73K short last week. Unchanged
  • JPY short 7K vs 11K long last week. Longs switch to shorts in an 18K drop
  • CHF short 13k vs 11k short last week. Shorts trimmed by 1K
  • AUD short 48k vs 46k short last week. Shorts increased by 2K
  • NZD short 40K vs 38K short last week. Shorts increased by 2K
  • CAD long 13K vs 5K long last week.  Longs trimmed by 1K
  • Prior week

The big moves in sterling came last week and I’m surprised there wasn’t any covering through Tuesday. That’s good news if you’re long GBP because it leaves lots of juice to squeeze.

Oil rallies to the highs of the week

WTI crude at the best levels since Friday

WTI crude at the best levels since Friday
There was a huge build in US oil supplies in data released today but the market has shaken it off. That’s a great sign for the bulls and it comes — in part — due to draws in products.
I think this could lead to some short-term upside but WTI needs to get above $56 to really make any headway.

Oil hit by double-whammy as Bolton turfed and EIA cuts demand forecast

Oil drops $1 fast

Oil drops $1 fast
WTI crude oil fell to $57.30 from $58.50 in a quick move after Trump announced he was firing national security advisor John Bolton. It’s since bounced back 40 cents.
Bolton has long favored military solutions everywhere, but particularly in the Middle East. The news diminishes the chances of bombs falling on Iran.
Minutes after that news, the EIA lowered its forecasts for world oil demand this year and next. They saw a rise of an 890,000 barrel per day rise compared to 1 million barrels previously for this year. For 2020, they trimmed the forecast by 30,000 bpd to a rise of 1.4mbpd.
Offsetting that somewhat is a lower forecast for US production next year at 13.23 mbpd compared to 13.26 mbpd.

WTI futures settle the day (and for the week) up $0.01 at $60.21

Up 0.02%

The price of WTI crude oil future are settling the day (and week) by the smallest of margins. The price is up 1 cent or 0.02% at $60.21.

The high for the day reached $60.74

The low extended to $59.93.
For the week, the pair is up $2.70 or 4.69% from the closing price of $57.51 last week. The gains were helped by a big drawdown of inventories on Wednesday of -9.499M barrels (expecting -3.0K).
Technically, the price moved above its 200 and 100 day MAs at $58.32 and $59.19 respectively. It will take a move back below those levels to hurt the bullish bias next week.
Up 0.02%

Don't be afraid to be a sheep

  1. Follow the trends. This is probably some of the hardest advice for a trader to follow because the personality of the typical futures trader is not “one of the crowd.” Futures traders (and futures brokers) are highly individualistic; the markets seem to attract those who are. Very simply, it takes a special kind of person, not “one of the crowd,” to earn enough risk capital to get involved in the futures markets. So the typical trader and the typical broker must guard against their natural instincts to be highly individualistic, to buck the trend.
  2. Know why you are trading the commodity markets. To relieve boredom? To hit it big? When you can honestly answer this question, you may be on your way to successful futures trading.
  3. Use a trading system, any system, and stick to it.
  4. Apply money management techniques to your trading.
  5. Do not overtrade.
  6. Take a position only when you know where your profit goal is and where you are going to get out if the market goes against you.
  7. Trade with the trends, rather than trying to pick tops and bottoms.
  8. Don’t trade many markets with little capital.
  9. Don’t just trade the volatile contracts.
  10. Calculate the risk/reward ratio before putting a trade on, then guard against holding it too long.
  11. Establish your trading plans before the market opening to eliminate emotional reactions. Decide on entry points, exit points, and objectives. Subject your decisions to only minor changes during the session. Profits are for those who act, not react. Don’t change during the session unless you have a very good reason.
  12. Follow your plan. Once a position is established and stops are selected, do not get out unless the stop is reached or the fundamental reason for taking the position changes.
  13. Use technical signals (charts) to maintain discipline – the vast majority of traders are not emotionally equipped to stay disciplined without some technical tools.

The Magical Number of Pi and Stock Markets

There are some magical numbers and sequences of numbers that have their prints in the nature. They were there in the first place because God who created the whole universe encoded them just like His signature or autograph. Now, we might wonder, why is these magical numbers so important in our discovering of the secrets of the stock market trading and investing business? The simple and quick answer to that question is that these numbers resonate and vibrate in the stock markets, commodity markets and forex just as they are found in the universe that we live in. This is true for any financial markets. Before you discredit my claim of the magical number pi (π) and its application in making money in financial markets, take a good look of Fibonacci. This magical sequence of numbers of Fibonacci that starts from 1, 1, 2, 3, 5, 8, 13, 21, and etc, had been a very good technical indicator of when (time) and where (price) should the index futures reverses its trend. The number of pi (π) is so magical that its decimal portion is unique and there is no repetition of patterns. Just in case that some of you wonder what pi (π) is, it is a constant number where pi π = 3.1415926535897932384626433832795… The study of market cycles and market geometry uses pi (π) to pin-point the exact reversal date and price for stock markets and other financial markets. Here I present to you a video that sings out the magical number of pi (π).


Go to top