rss

Stock market: The earnings of JPM, Netflix, Coca-Cola and more

A look at earnings season in the US this week

FBS 1
The new earnings season is starting this week in the United States. This means that stocks of the largest American companies will likely make big moves. Below we have gathered some important information for those who want to trade on these releases.

Tuesday, October 15

Citigroup
EPS forecast: $1.95
Revenue forecast: $18.52B

Citigroup is the forth fourth biggest of the four “too big to fail” American banks. It has a long history of reporting better-than-expected earnings: that happened during the past 18 quarters. This time, analysts expect the bank to once again deliver good results.

Apart from earnings per share and revenue, investors will look at Citigroup’s margins (the bigger, the better for the stock) and the buyback program (the bigger, the better for the stock).

Technically, this year the stock of Citigroup has performed rather well after having a bad 2018. The price has firstly recovered 50% of the last year’s decline and then consolidated in a broad range between $61 on the downside and $73 on the upside.

However, Citigroup still didn’t manage to regain the highs of 2018 as bank stocks, in general, are pressured by the falling interest rates. Now it’s closer to the upper border of this sideways range, in the $70.00 area: the stock got support from the 50- and 100-week MAs at $65 and $68.25. Notice, however, that both weekly and daily MAs are horizontal.

This means that the price lacks overall momentum. The movement after the earnings report should be tied to the mentioned technical levels.

(more…)

US stocks end the day with modest declines

Semi holiday trading leads to modest price action

The US major stock indices are ending the day with modest declines. The Columbus Day holiday limited price action.  Government offices and agencies were closed as was the bond market. However the US stock market and futures markets were open.
The final numbers are showing:
  • The S&P index -4.12 points or -0.14% at 2966.15
  • The NASDAQ index -8.391 points or -0.10% at 8048.64
  • The Dow industrial average is down -29.23 points or -0.11% at 26787.30.

US Indices ended the day with gains but well off highs

Buy the rumour, sell the fact. Major indices closing near intraday lows.

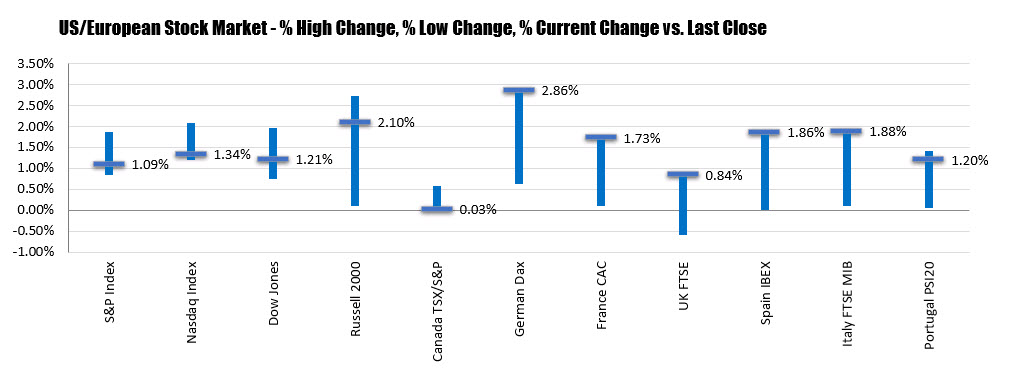
Perhaps a little buy the rumour selll the fact.  Nevertheless, the major US stock indices are ending the day with decent (over 1%) gains in trading today. It is just not as good AND the major indices are ending nearer the intraday lows for the day.
The final numbers are showing:
  • S&P index, +32.13 points or 1.09% at 2970.26, The high reached 2993.28
  • NASDAQ index up 106.257 points or 1.34% at 8057.04. The high reached 8115.797.
  • Dow industrial average rose 330 points or 1.25% at 26814. The high reached 26975.
Below is a view of the low, high and close % changes.
Buy the rumour, sell the fact. Major indices closing near intraday lows.

US stocks close higher but off session highs

Hopes for progress on US/China

Secretary of the Treasury Mnuchin has left the trade meetings without saying anything to the press.  Pres. Trump is to meet with China vice premier on Friday.  Who knows how the cards fall but the major indices traded with confidence today. Hopes for a Brexit solution (or at least some progress with UK and Ireland) may have also contributed to a better tone.
The final numbers are showing:
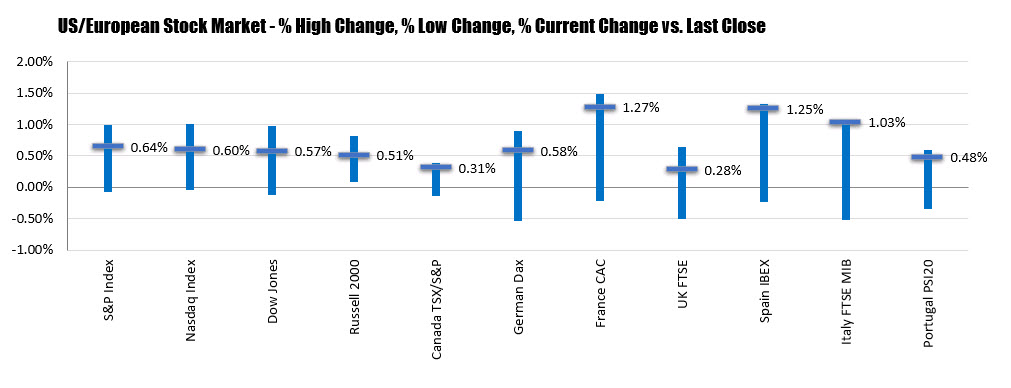
  • The S&P index rose 18.73 points or 0.64% at 2938.13
  • The NASDAQ index rose 47.038 points or 0.60% at 7950.78
  • The Dow rose 150.66 points or 0.57% at 26496.62.
The percentage high, low and close for the major indices in North America and Europe are shown in the chart below:
Hopes for progress on US/China

US Indices end higher but late China headlines take some shine off the day’s gains

Some of the declines were retraced

The major indices are ending the session with gains but some late day headlines from China that the blacklist announced earlier in the week, has lowered their trade expectations for the trade meetings this week (or so they say). Those meetings will begin tomorrow and are expected to go through Friday.
Although of the highs, the indices have retraced some of the declines from yesterday that saw the NASDAQ index fall -1.67%. The S&P index fall -1.56%, and the Dow fall -1.19%.
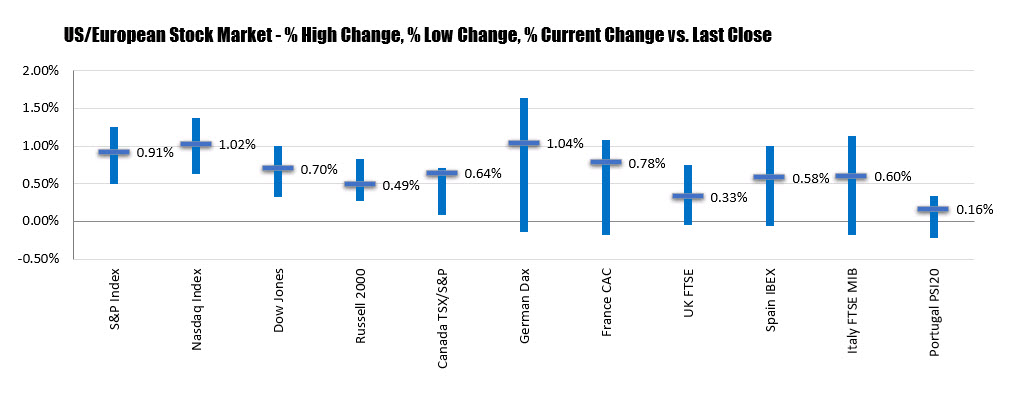
Today the closing levels are showing:
  • The NASDAQ index up 79.9 points or 1.02% at 7903.74. The high reached 7930.91. The low extended to 7873.516
  • The S&P index up 26.43 points or 0.91% at 2919.49. The high extended to 2929.32. The low reached 2907.41
  • The Dow industrial average up 181.97 points or 0.70% at 26346.02. The high reached 26424.31. The low extended to 26249.75.
Below is a graphical representation of the high, low and close percentage changes.
Some of the declines were retraced

Ahead of the FOMC minutes this week, a forecast of an October rate cut

UBS are citing the US slowdown to potentially arrive sooner than expected

  • Which, they say, opens the door to a Fed funds rate cut in October.
(Federal Open Market Committee meeting is October 29 and 30)
Citing trade tension with China –  a substantial shock to the economy – tariffs causing a slump in private demand
  • tarfifs weakening employment in manufacturing, retail
Following that the bank expects further cuts in:
  • January, March and June 2020
  • And also say that due to the run of recent data there is risk is to the downside for the Fed to cut more.

US stocks end near the lows but give up gains

Early declines still holding the lows

The US stocks are ending the day near, but above) the day’s lows (from earlier in the day) but they gave up gains in the processs in what was an up and down day.
The final numbers are showing:
  • The S&P index fell -13.22 points or -0.45% at 2938.79. The high reached 2959.75. The low extended to 2935.68
  • The NASDAQ index fell -26.181 points or -0.33% at 7956.29. The high reached 8013.316. The low extended to 7942.08
  • The down industrial average fell -95.70 points or -0.36% at 26478. The high reached 26655.84. The low extended to 26424.54

The NASDAQ index closed below its 100 day moving average at 7967.39. The index close back above that MA on Friday. Failure to keep the momentum to the upside going is a disappointment for the bulls.

The S&P index remains above its 100 day moving average at 2928.07, but is closing below its 50 day moving average at 2940.64
Go to top