rss

US stock futures fall to session lows as New York rolls in

It’s going to be an interesting one

It's going to be an interesting one
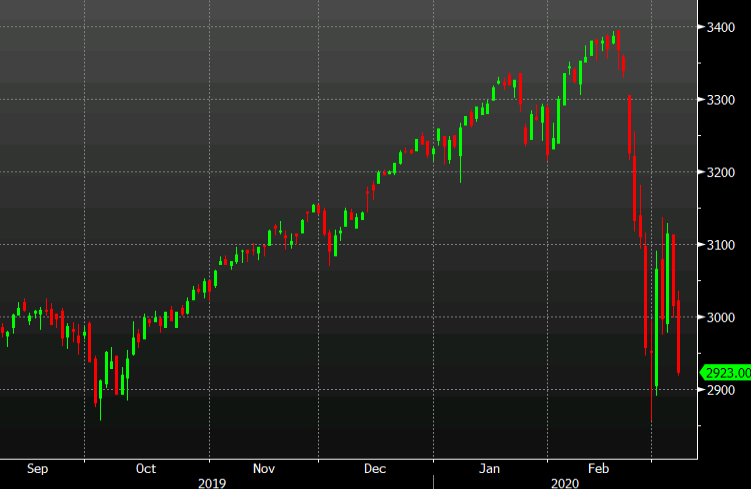
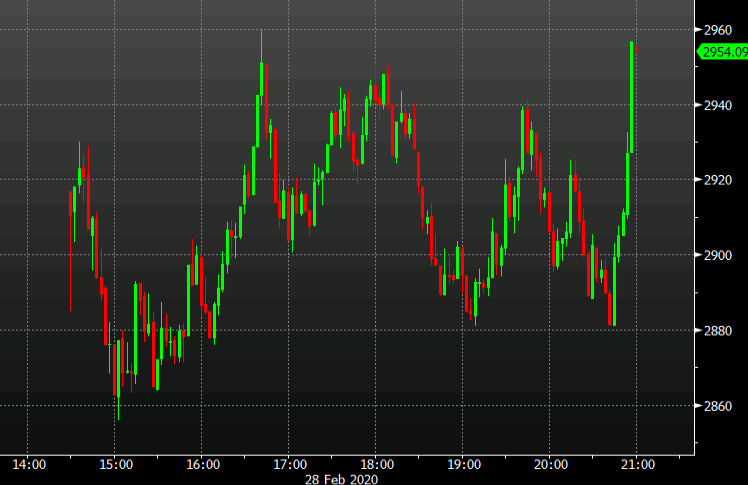
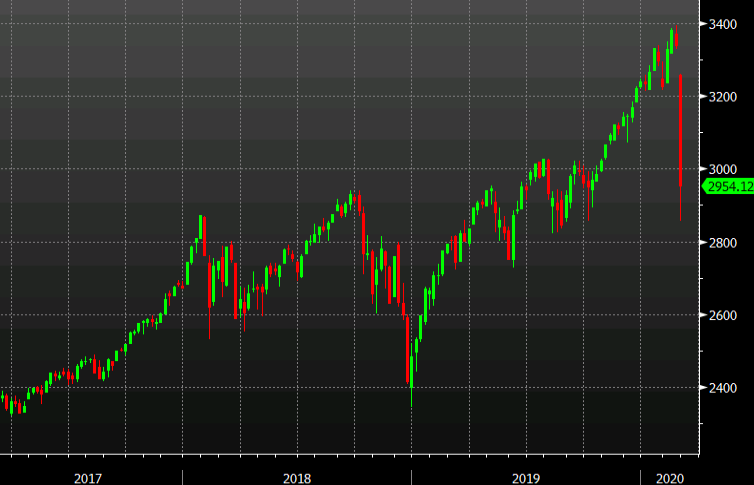
S&P 500 futures are down 94 points following a 106 point decline yesterday. That more-than wipes out there 2% gain so far this week.
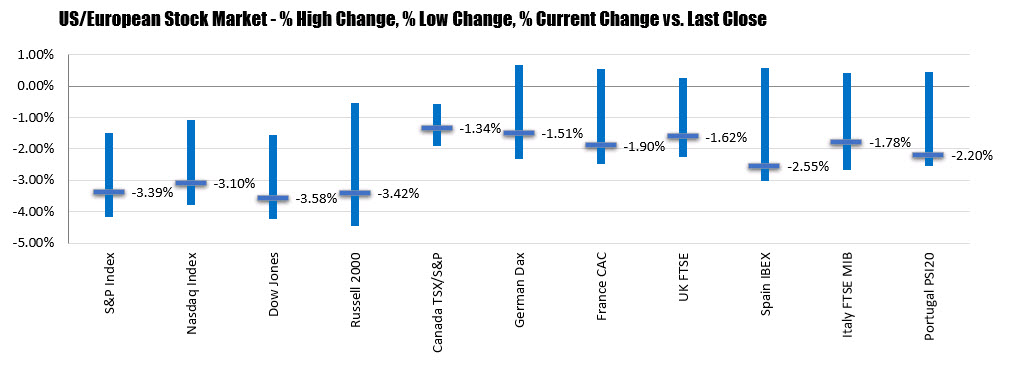
It’s a bloodbath in Europe as well with all the main indexes down around 3.5%.
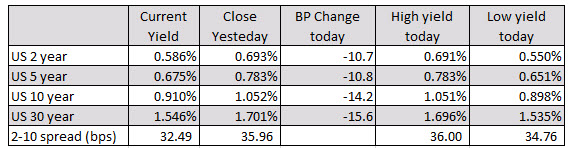
What’s frightening is the drop in bond yields. US 10-year yields are down a whopping 17 basis points to 0.75% after falling to as low as 0.69%. Those numbers are below the T-bill yield of 0.755% and Fed funds. That’s a fresh inversion despite a 50 basis point cut on Tuesday.
With those declines, the dollar’s yield advantage is getting wiped out and as a result it’s falling sharply against the low yielders — JPY, CHF and EUR. I expect to see some additional dollar weakness but we’re fast-approaching the lower bound and the Fed has been steadfast that it won’t go negative. Once we get there, I think the dollar will start to appreciate again on safe haven flows.

Another sharp day down in the major US indices

Yields fall to new lows

The risk off flows continued in the US stock market and debt market.
The Dow industrial average was down over 1000 points at 1 point during the day. The S&P index fell below the 3000 level briefly before rebounding in the last hour of trading.
In the US debt market yields resumed their downward bias after yesterdays modest rebound.
The final numbers for the major indices are showing:
  • S&P index -106.18 points or -3.39% at 3023.94. The low price extended to 2999.83. The high was up at 3083.04
  • NASDAQ index fell -279.49 points or -3.10% at 8738.59. The low price reached 8677.387. The high price extended to 8921.078
  • Dow industrial average fell minus this 969.58 points or -3.58% at 26121.28. The low price extended to 25943.33. The high price reached 26671.92
In the US debt market the 10 year yield fell to a new record low level of 0.898%. It is currently trading at 0.91%. That is still down -14.2 basis points on the day. The yield curve flattening a bit to 32.49 basis points from close to 36 basis points the close yesterday, but all maturity levels fell by over -10 basis points.

US yields tumbled lower

US stocks close lower. Dow down nearly 800 points

Fed rate cut did not help but up and down day in US stocks

The US major indices had a volatile up and down trading day. At the end, the indices all closed sharply lower with each down over -2.8%.
The final numbers are showing:
  • S&P index -87.09 points or -2.82% at 3003.14
  • NASDAQ index -268.07 points or -2.99% at 8684.09
  • Dow down -788.56 points or -2.95% at 25914.93

The major indices initially rallied after the 50 basis point emergency meeting cut by the Fed, but as Fed Chair Powell’s is conference got underway and the Fed chair was perhaps less dovish than the market expected, the stocks gave up gains.

The S&P closed below it’s 200 day MA. At 3049.01, after trading above and earlier in the session. The S&P index is still above the low price from last Friday at 2855.94. That corresponded with the low from October 2019, and is a key target on the downside
The Nasdaq index closed below its 100 day moving average at 8836.91. It will take a move above that level to hurt the negative bias. The 200 day moving average is down at 8401.716

Dow closes up over 5% on the day

Major indices close at session highs.

The Dow had the biggest point gain ever, and in the process moved higher by over 5% on the day. The S&P index broke a 7 day decline and rose 4.61%. The NASDAQ index was a laggard with only a 4.5% gain.
The final numbers are showing:
  • The S&P index up 136.27 points or 4.61% at 3090.47. The S&P index closed above its 200 hour moving average at  3048.38. Now the price is above that moving average the next target would be the 100 day moving average at 3168.69
  • The NASDAQ index is ending the day up 384.797 points at 8952.16. That is a gain of of 4.49%. Technically, the price moved above its 100 day moving average at 8828.31. Its 50 day moving average looms ahead at 9245.93.
  • The Dow industrial average is closing up 1293.9 points or 5.09% at 26703.26.  Although the gain was the biggest point gain on record, the index still remains below its 200 day moving average at 27241.99.
Some of the bigger gains include:
  • Tesla, +11.46%
  • Costco, +9.95%
  • Apple, +8.85%
  • Gilead, +8.69%
  • Twitter, +7.92%
  • Walmart, +7.59%
  • UnitedHealth, +7.04%
  • Microsoft, +6.67%
  • Citigroup, +6.56%
  • Travelers, +6.56%
  • Merck, +6.3%
  • Amgen, +6.28%
  • Target, +5.9%
  • Intuit, +5.87%
  • Verizon, +5.82%
  • MasterCard, +5.73%
  • Visa, +5.53%
  • Home Depot, +5.45%

Losers on the day include:

  • Lyft, -3.12%
  • Square, -3.10%
  • First Solar, -1.92%
  • Chewy, -1.83%
  • Deutsche Bank, -1.3%
  • Alcoa, -1.15%
  • Daimler, -1.09%
  • FedEx, -0.75%
  • Chipotle, -0.71%
  • Papa Johns, -0.5%
  • United Airlines, -0.47%

US stocks catch a big bid in the final 15-minutes of trading to limit the damage

Dramatic move late

The S&P 500 finished the day down just 24 points at 2954 in a big win for the bulls late in the day.
The index gained more than 70 points in the final 15 minutes of trading in a huge bid, that was likely helped by month-end rebalancing. The huge rallies in bond and selling in stocks this month left pensions and other balanced funds heavily overweight bonds, so they’re forced to buy to get back on target.
There may also be hopes for an emergency Fed cut on the weekend or some good coronavirus news. There’s no doubt the market could have overshot this week, with the S&P 500 posting its worst weekly performance since October 2008 — when Lehman Brothers collapsed.
The intraday chart shows the huge reversal that kicked off a test of the earlier low of 2880.
SPX
On the day:
  • S&P 500 -25 points to 2954 (-0.8%)
  • Nasdaq – flat
  • DJIA -1.4%
On the week:
  • S&P 500 -11.5%
  • DJIA -12.4%
  • Nasdaq -10.5%
The weekly chart is still ugly but at least the bulls have some lift as we closed off the weekly lows:
SPX weekly
We will have to get back above the 200-dma at 3046 to generate any real optimism.

Bloodbath : Major indices get hammered. All 3 major indices down -4.4% on the day

Major indices lose 1% additional in the last 15 minutes of trading on major liquidation

the major indices in the US get hammered once again with the Dow, S&P and Nasdaq indices all lower by -4.4%

The S&P and Dow had there worst point drop in history (not % though).  Major indices all closed in correction (down over 10% from the highs).
The final numbers are showing:
  • S&P index, -137.89 points or -4.42% at 2978.51.
  • The NASDAQ index -414.29 points or 4.61% at 8566.48.
  • Dow industrial average 1192.27 points or -4.42% at 29765.33
Year to date, the
  • Dow is down -9.71%
  • S&P is down -7.8%
  • Nasdaq is down -4.53%
From the high last week, the major indices are showing:
  • NASDAQ index -13%
  • S&P is down -12.30%
  • Dow is down about 12.9%
The Vix, often called the fear index has moved up to 38.5. That surpasses the 36.2 high from December 2018.  That’s the highest level since February 2018. The highest volatility index going back to 2015 moved up to 50.3 and 2018 and 53.29 and 2015.
Go to top