rss

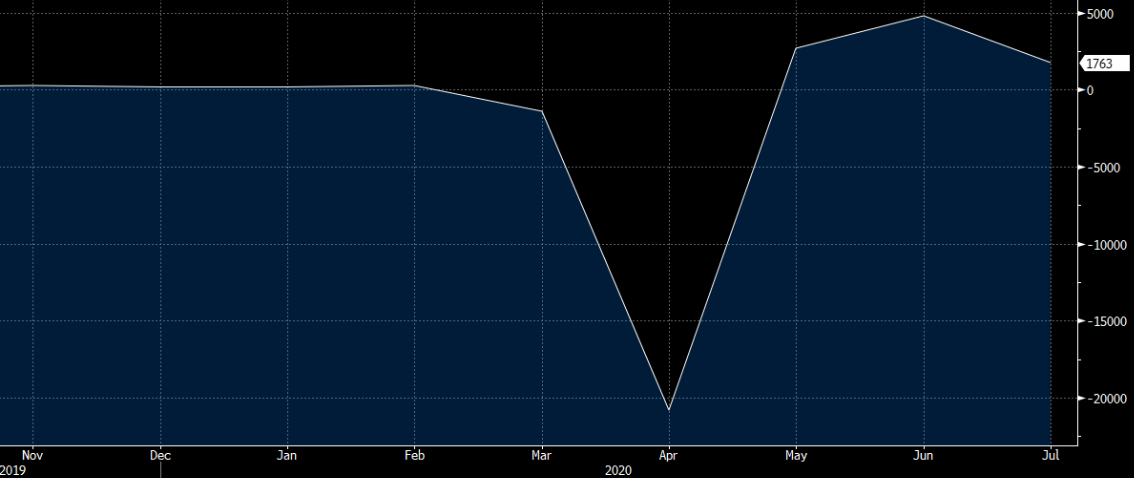
US July non-farm payrolls +1763K vs +1480K expected

US July 2020 non-farm payrolls data

nonfarm payrolls chart
  • Prior was +4800K (revised to 4791K)
  • Two month net revision +17K
  • Change in private payrolls +1462K vs +1200K expected
  • Change in manufacturing payrolls +26K vs +255K expected
  • Unemployment rate 10.2% vs 10.6% expected
  • Adjusted for misclassification 11.1%
  • Prior unemployment rate 11.1%
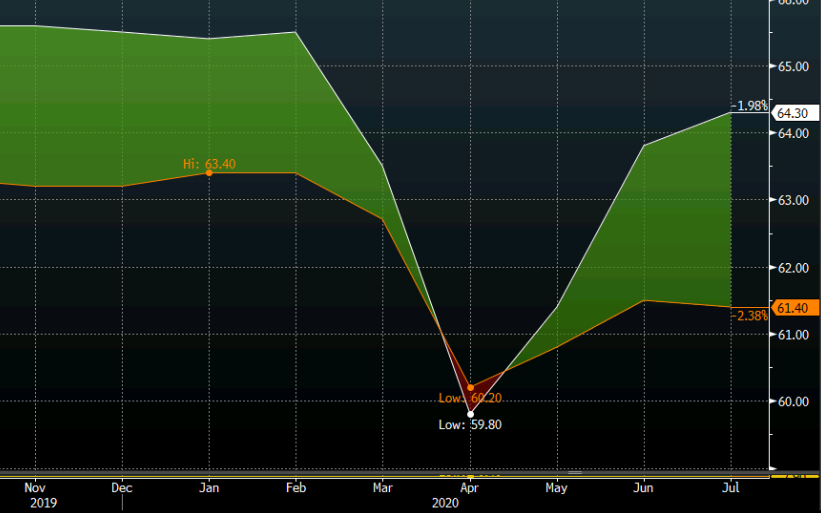
  • Participation rate 61.4% vs 61.8% expected
  • Prior participation rate 61.5%
  • Underemployment rate 16.5% vs 18.0% prior
  • Average hourly earnings +0.2% m/m vs -0.5% expected
  • Average hourly earnings +4.8%% y/y vs +4.2% expected
  • Average weekly hours 34.5 vs 34.4 expected
  • Employment in the household survey +1.4m
  • Part time jobs +803K
  • Full time jobs little changed
  • Full report
I noted before the report that a seasonal adjustment quirk was likely to add nearly 1m jobs to payrolls. It only added 245K jobs. From the BLS:
Government employment rose by 301,000 in July but is 1.1 million below its February level. Typically, public-sector education employment declines in July (before seasonal adjustment). However, employment declines occurred earlier than usual this year due to the pandemic, resulting in unusually large July increases in local government education (+215,000) and state government education (+30,000) after seasonal adjustment.
However it was even stronger than that and the majority of it was in private payrolls. The unemployment rate was also better but you can discount most of that because of a dip in participation rather than the rise expected.
Looking at the US and Canadian jobs data together, one thing that caught my attention is the growing gap in labor force participation. The Canadian participation rate now 1.2 pp below Feb levels while US 1.9 pp lower. I would have expected it the other way around with more of Canada shut in July. That will be something to watch in the months ahead.
US vs Canada participation rate

UK think tank says unemployment will reach 10% this year

UK think tank, NIESR, comments on the UK economy

UK
  • Sees unemployment rate hitting almost 10% this year due to “premature” end to the government’s furlough program
  • Says government is making a mistake by cutting furlough program in October
  • Says that increases the risks of economic scarring
  • Forecasts UK economy to shrink by 10.1% in 2020, before growing by 6.1% in 2021

That is one take on the whole situation but if the health crisis gets worse in the coming months, who is to say that the UK government would not use that as an excuse to keep the furlough program running until the year-end.

For now, a lot about UK economic data – especially in relation to the labour market – is largely masked by the fact that the government’s furlough program is in place.
We will only get a better idea of how the economy is standing on its own two feet once the program expires. Things may be looking “good” for now but should there be substantial layoffs to come, it could lead to a bigger hit to the economy down the road.

FOMC central tendencies and dot plot for projected rates. Fed projects rates to remain at current levels through 2022.

Central tendencies and dot plot for June 2020

The last time the central tendencies and dot plot was released was way back in December 2019.  At that time, the world was different place.

At the time in December, the Central tendencies saw 2020 numbers at:
  • GDP 2.2%
  • unemployment rate 3.5%
  • PCE inflation 1.9%
The 2021 projections saw:
  • GDP 1.9%
  • unemployment 3.6%
  • PCE inflation 2.0%
The projection for the Fed funds rate at the end of 2020 was 1.6%.  For 2021 the rate rose to at 1.9% with the 2022 rate at 2.1%.
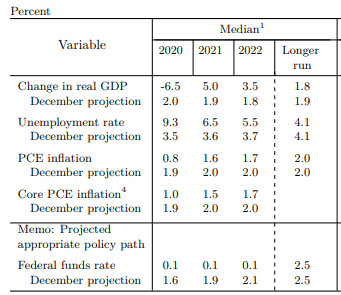
The current median estimate for central tendencies shows 2020 numbers at:
  • GDP -6.5%
  • unemployment 9.3%
  • PCE inflation 0.8%
The projections for the Fed funds rate at the end of 2020 comes in at 0.1%. For 2021 the rate targets 0.1% with the 2022 rate targeted also at 0.1%.
Below is the chart of central tendencies from the Federal Reserve
Central tendencies
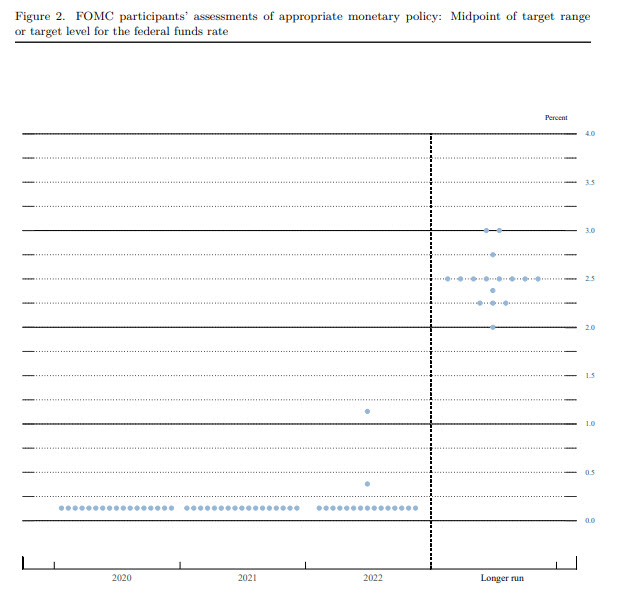
Below is the dot plot with all participants keeping the rate at 0.1%.  In 2022, there are two voting members to forecast day higher rate.  The market was looking for the Fed to keep rates low through 2022
Dot plot

NBER says US recession began in February

Business Dating Cycle Committee says contraction ongoing

The US National Bureau of Economic Research says the American economy fell into recession in February to end an expansion that started in June 2009.
It was the longest expansion in US history at 128 months.
In determining the date of the monthly peak, the committee considers a number of indicators of employment and production. The committee normally views the payroll employment measure, which is based on a large survey of employers, as the most reliable comprehensive estimate of employment. This series reached a clear peak in February.
There’s no magic in determining a recession but the NBER generally gets the privilege of making the call in the US.

The US economic recovery – V, W or Nike shaped?

The shape of the US economic recovery ahead is much discussed, will it be L, V, U, or W shaped? Seriously, this is a debate!

Now there is a new contender – the Nike Swoosh shaped recovery. This is probably a read for the weekend with a glass of something (really strong most likely) in hand:
  • the recovery could be shaped more like a Nike swoosh. The bottoming out process may take a little longer to take hold, but once the rebound starts it would be steady and gradual.
Piece is here if you’d like more.
Why not ASICS shaped instead?
The shape of the US economic recovery ahead is much discussed, will it be L, V, U, or W shaped? Seriously, this is a debate!

Fitch says : Deep Global Recession in 2020 as Coronavirus Crisis Escalates -Full Text

Fitch Ratings-London-02 April 2020: A deep global recession in 2020 is now Fitch Ratings’ baseline forecast according to its latest update of its Global Economic Outlook (GEO) forecasts.

The speed with which the coronavirus pandemic is evolving has necessitated another round of huge cuts to our GDP forecasts. We now expect world economic activity to decline by 1.9% in 2020 with US, eurozone and UK GDP down by 3.3%, 4.2% and 3.9%, respectively. China’s recovery from the disruption in 1Q20 will be sharply curtailed by the global recession and its annual growth will be below 2%.

“The forecast fall in global GDP for the year as a whole is on a par with the global financial crisis but the immediate hit to activity and jobs in the first half of this year will be worse”, said Brian Coulton, Fitch’s chief economist.

The spread of the pandemic and the actions necessary to control it mean that we now have to incorporate full-scale lockdowns across Europe and the US (and many other countries) in our baseline forecasts. This was not the assumption used in our March 2020 GEO forecast. There are many moving parts, but we now judge that lockdowns could reduce GDP across the EU and US by 7% to 8%, or 28% to 30% annualised, in 2Q20. This is an unprecedented peacetime one-quarter fall in GDP and is similar to what we now estimate occurred in China in 1Q20.

On the assumption that the health crisis is broadly contained by the second half of the year there should be a decent sequential recovery in activity as lockdowns are removed, some spending is re-profiled from 1H20, inventories are rebuilt and policy stimulus takes effect. But this has to be set against the many factors amplifying the depth of the dislocation, including job losses, capex cuts, commodity price shocks and the rout in financial markets.

“Our baseline forecast does not see GDP reverting to its pre-virus levels until late 2021 in the US and Europe,” said Coulton.


(more…)
JP Morgan on the US: “We continue to believe that a recession has begun in March”

JPM:
  • We expect unemployment to peak near 8.5%.
  • Our model of the risk of the recession beginning within one year based on the economic data jumped to 90% after the report
  • We continue to believe that a recession has begun in March
  • Additionally, the Transportation Security Administration has released daily data on the number of travellers passing through TSA checkpoints. The number of travellers was down 89% relative to last year through March 25

This is the biggest jobless claims report in a long time

Initial jobless claims top the economic calendar

Initial jobless claims top the economic calendar
The weekly initial jobless claims report at the bottom of the hour is for the week ending March 14 so it’s before the real coronavirus crunch, which is a week or two away.
Last week was 211K and the ‘consensus’ this week is 220K but that’s far lower than what the market is expecting. State unemployment claims in some places are up 5x to 10x.
Last week I was warning about this and when I wrote that ‘The coming wave of unemployment claims is going to be unprecedented‘ there were comments like this:
Where are you guys coming up with this stuff… I was out last night eating and food places are full stores are full… you are acting like this is the end of the world…this is being blow up to be way way more that what it is… which is nothing more than a cold with a twist on it that has not even gone above last year flu session. This is completely stupid what the news media is doing.
Now it’s conventional wisdom.
What we haven’t figured out is if the bureaucracy can handle and process the level of claims to actually get people the money. That’s more important right now than a $1 trillion piece of legislation the White House is proposing to get people money at the end of April.

US January nonfarm payroll report is due Friday 7 February 2020 – preview

Snippet from Goldman Sachs on what they expect

  • +190k
  • unemployment 3.5%
Citing:
  • initial jobless claims declined further
  • ADP job gains were significantly larger than expected
  • an unseasonably dry survey week in the Northeast and Ohio Valley is set to boost weather-sensitive categories
  • January job growth tends to accelerate in tight labour markets, as labor supply constraints may lead firms to implement fewer end-of-year layoffs
Go to top