Not a good day for the major stock indices
The major US stock indices were spooked by weaker than expected ISM manufacturing data . Shortly after the data came out, the major indices turned from being up to being down.
The momentum continued through the day.
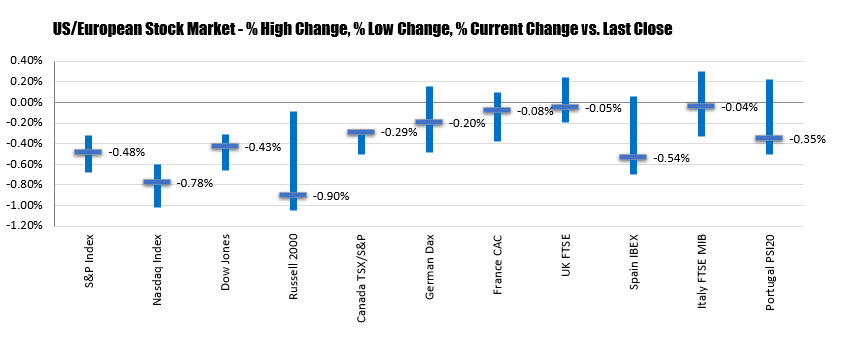
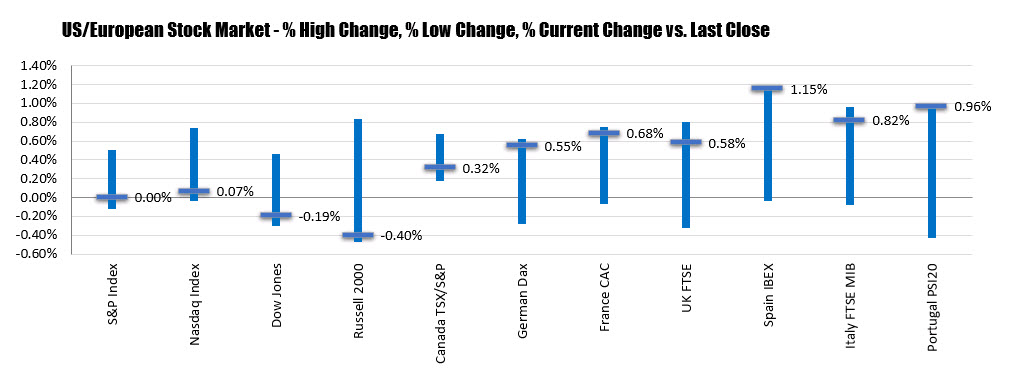
The final numbers are showing:
- S&P index, -36.56 points or -1.23% in 2940.18. That is just off the session low at 2938.70. The pair fell below its 50 day moving average today which had been holding support for most of September. That MA comes in at 2948 area. Stay below going forward keeps the bears in control. The 100 day MA is down at 2925.50 currently. A move below that level increases the bearish bias for the pair
- NASDAQ index, -90.654 points or -1.3% at 7908.68. The low for the day reach 7906.293. For the Nasdaq index, it tumbled below its 100 day moving average at 7963.81 today. The next major target would be its 200 day moving average. However that is still a bit away at 7704.411.
- Dow fell -343.79 points of -1.28% at 26573.04.. The low for the index reached 26562.22.
Selling with broad-based today with all the major sectors moving lower.
Some of the major losers today included:
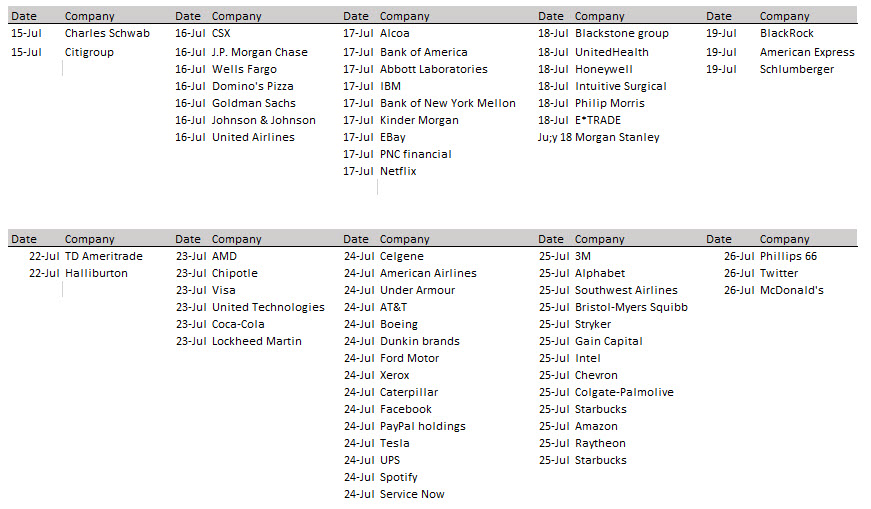
- Charles Schwab, -9.73%. They lowered commissions $0 on trades
- DuPont, -4.73%
- Schlumberger, -4.36%
- 3M, -3.67%
- General Motors, -3.66%
- Slack, -3.46%
- Cisco, -3.36%
- Caterpillar, -3.14%
- Morgan Stanley, -3.05%
- Ford motors, -2.84%
- Wells Fargo, -2.76%
- Fed ex, -2.72%
- McDonald’s, -2.64%
- Bank of America, -2.50%
- Exxon Mobil, -2.37%
- Twitter, -2.33%
- Goldman Sachs, -2.20%
Some winners on the day included
- Phillip Morris, +2.52%
- Tesla, +1.59%
- Visa, +1.34%
- Box, Inc, +1.15%
- Wynn resorts, +1.11%
- Netflix, +0.73%
- Papa John’s +0.42%
- Coca-Cola, +0.37%
- Apple, +0.25%
- Pepsi, +0.20%
 In other markets as London/European traders look to exit:
 A snapshot of the forex market shows that the GBP is still the strongest of the majors (but off earlier higher levels). The JPY and USD remain the weakest. The CAD has gotten stronger on stronger oil and a was dovish Bank of Canada statement.