On the day:
- S&P 500 down 2.8%
- DJIA -2.6%
- Nasdaq -3.2%
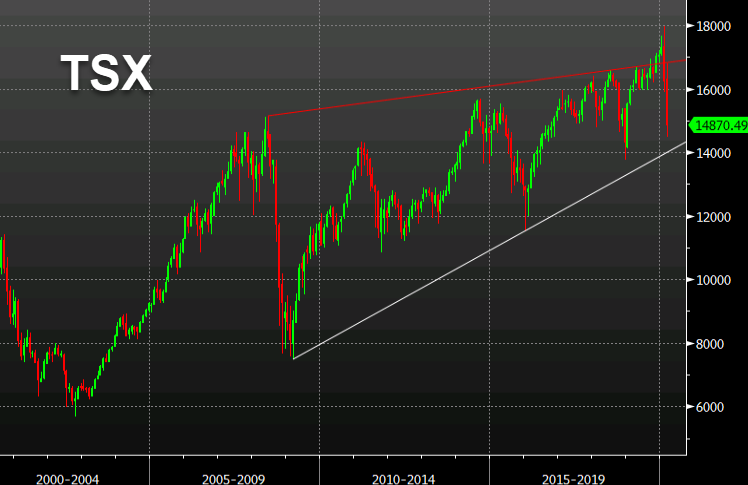
- TSX -1.0%
On the week:
- S&P 500 down down 0.2%
- DJIA -0.2%
- Nasdaq -0.3%
- TSX +1.4%
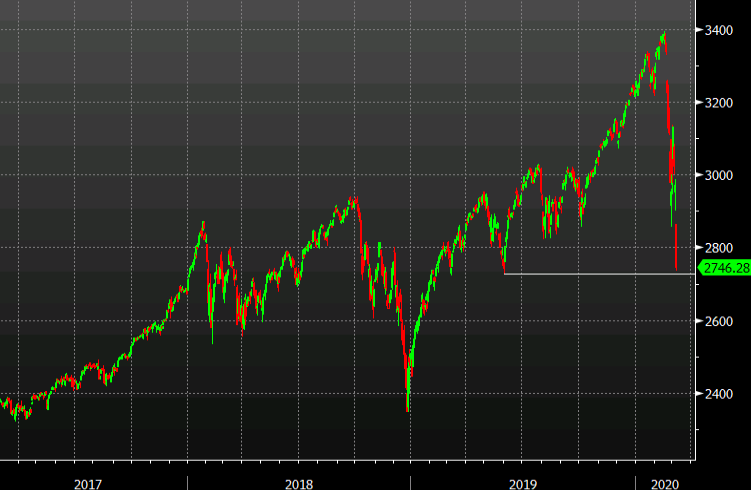
Here is a look at the weekly S&P 500 chart. That latest candle isn’t a pretty one:

Here is a look at the weekly S&P 500 chart. That latest candle isn’t a pretty one:
Some of the leading stocks include:
YTD, the Dow al so is leading the declines:
The closing levels are lower at:
 Although lower for the day for all major indices closed with gains.
Yesterday both the S&P index and the Dow closed higher for the 2nd day in a row. The NASDAQ did not join them as it fell in trading yesterday. However all 3 indices are closing higher in trading today with solid gains. The indices closed near/at the session highs.
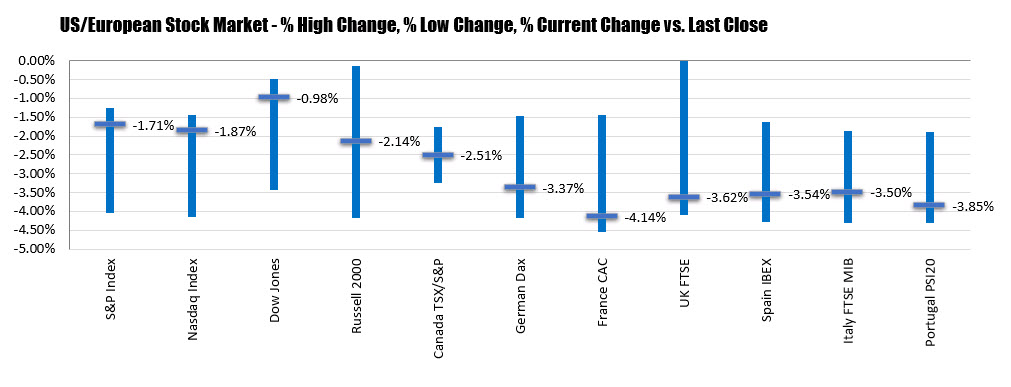
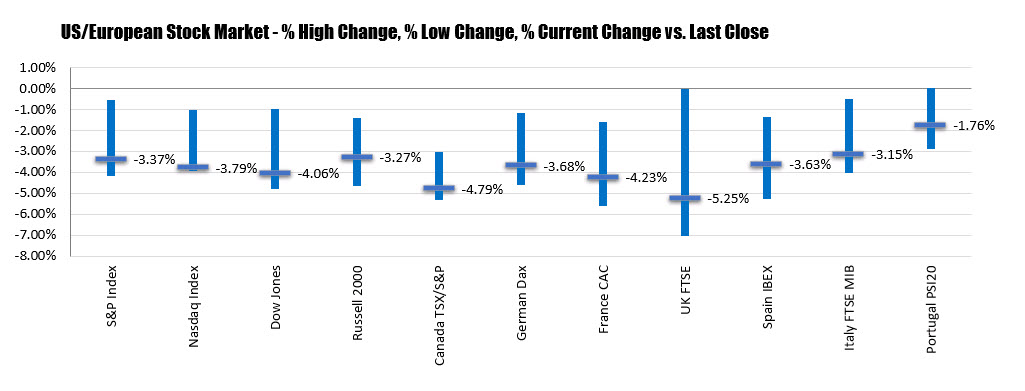
The indices are also closing well off there lows for the day (the major indices did not go negative today). Looking at the % low, % high and % Close, the % lows for the indices reached:
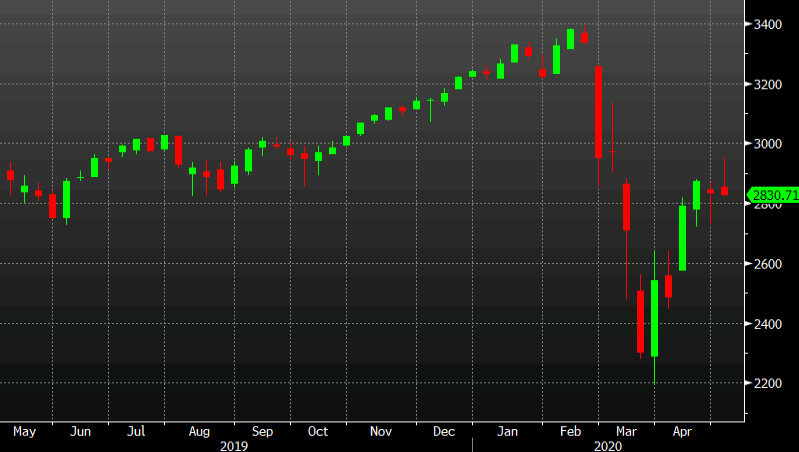
Finally, going back 1 year: