rss

S&P and NASDAQ index close at record highs

Dow industrial average leads the way

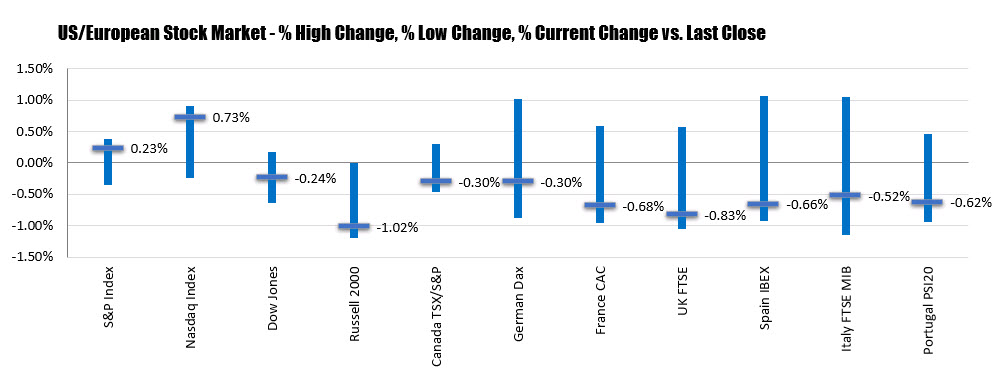
the S&P and NASDAQ index both closed at record levels, but for the day the Dow industrial average was the biggest percentage gainer.

The final numbers are showing:
  • S&P index up 11.73 points or 0.35% at 3397.24.
  • The NASDAQ index rose 46.848 points or 0.42% at 11311.80
  • Dow industrial average rose 190.84 points or 0.69% at 27930.53

For the week, the NASDAQ led the way. The Dow industrial average ended the week unchanged.

  • S&P index rose 0.72%
  • NASDAQ index rose 2.65%
  • Dow industrial average was unchanged

For the year to date, the Dow industrial average still remains down. The NASDAQ index continues its stellar performance.

  • S&P index +5.15%
  • NASDAQ index +26.07%
  • Dow industrial average -2.13%
Some of the big gainers today included:
  • Apple, +5.14%
  • dear and Company, +4.39%
  • Nvidia, +4.43%
  • Tesla, +2.39%
  • Qualcomm, +2.15%
  • Corning, +1.88%
  • Nike, +1.63%
  • Marriott, +1.35%
  • AMD, +1.27%
  • Chipotle, +1.13%
  • Costco, +1.12%
  • J&J, +0.9%
  • Home Depot, +0.9%
Big losers today included:
  • Slack, -2.97%
  • United Airlines, -2.97%
  • Papa John’s, -2.16%
  • Uber, -1.85%
  • Box, -1.83%
  • Deutsche Bank, -1.71%
  • Beyond Meat, -1.5%
  • Delta, -1.27%
  • Boeing -1.25%
  • Raytheon technologies, -1.21%
  • Whirlpool, -1.17%
  • Netflix, -1.1%

Baker Hughes oil rigs 183 vs. 172 last week

Total rig counts up to 254 from 244 last week

In a surprise, the Baker Hughes rig counts moved higher this week.

  • Total rigs moved to 254 from 244 last week. This is the 1st increase in 24 weeks.
  • Oil rigs rose by 11 to 183 from 172 last week. This is the largest weekly gain since January
  • Gas rigs fell by 1 on the week to 69 from 70 last week
The oil rigs reached the lowest level since 2005 last week. The move up to 183 is the highest since July 3 when rigs came in at 185.
Oil rigs
Crude oil is trading at $41.65 for the October contract. That is little changed to the pre-release level.
Looking at the daily chart below, the contract remains above its 50 day average at $40.95 (white moving average line in the chart below) and below its 200 day moving average of $43.41. The range since August 6 as a low $41.33 and a high of $43.29. The low today reached $41.46 just above the low of that range.
In between the moving averages sits the 50% retracement of the 2020 trading range which comes in at even $42. As I type, the price has moved higher and currently trades at $42 – right at that 50% level. Get above and we could see further upside momentum.
At some point, the ups and downs will cease and we will get a break. The moving averages will represent key breakpoints. Focus on those levels.
Crude oil prices for the October contract

Selling Out at a Good Price and Re-Entering at a Worse Price

  • Reasons
    • You think that the price is going down, so you sell at $X. Price drops below $X, you feel good that you sold out earlier, then you shift your attention to other things. Now and then you check the price again, and saw that it kept going lower, so you still feel good. Then after a while you start to notice that the price is inching back to $X, so you start to think ‘hmm.. look’s like it’s going back up, maybe I shouldn’t have sold. Let’s monitor this for a while, see what happens’. Your ‘Fear of Missing Out’ and your ‘Fear of Future Regret’ is starting to grow.
    • All the while, you had no concrete action plan on how you would handle this, you have not decided at what price or point you would go back in, or would you cut this position out entirely. Without a trading plan decided beforehand, you are bound to react to your emotions.
    • Soon, the price moves above $X, and keeps moving up. Finally, you can’t take it anymore, you re-enter your position at a price higher than $X. That helped to ‘quieten’ your ‘Fear of Missing Out’.
    • Then as it usually happens, price goes back down again, drops below $X and goes down further. Either your fear of taking a loss kicks in and you stick with a losing position, or you sell out at a loss.
  • Solutions
    • You have to decide beforehand, even before you exit the position, how you would handle the position.  To do that,  you need to be clear on the reason why you are selling in the first place.
    • If you are selling because you think that the uptrend has changed to a downtrend, or the uptrend is broken, you would need to have specific criteria that you look for to know whether the uptrend has resumed. If the criteria has not been met, even if the price goes above $X, you will not re-enter your position.
    • If you are selling because you think the uptrend is still intact but there will be a short momentum reversal, you need to get out and get back in very quickly, usually just catching 1-2 ticks more. This type of play where you react to momentum is highly discouraged. The risk-reward is bad, the skill level, reaction speed, concentration required are extremely high, and it makes you susceptible to falling into the trap of ignoring the bigger market structure.
    • You have to realize that you are playing into the hands of the usual fighting that goes between bulls and bears when you keep reacting to the swings, which will naturally make you buy high and sell low.
    • In conclusion, you need to be very clear of reason that you are selling. In that way, you would be clear of when, if ever, you would re-enter the position.

Hesitating on Entry and Ending Up Chasing the Market

  • Reasons
    • You just had a string of losses and you don’t dare to enter the next trade.
    • You are not sure whether to take the entry signal, you do not trust your system completely.
    • You were not paying full attention to the market, so your mind was not prepared to play, so you got stuck in indecision.
    • You take too long to weigh all the arguments for the bull and bear sides.
    • Chased market for fear of missing out. End up entering trades with stops being too far away.
    • Might be the case where you detected hesitation, and you know hesitation is bad, and you simply brush hesitation aside without thinking and just enter the position.
  • Solutions
    • If you hesitated and missed the proper entry, wait for a retracement.
    • If no retracement occurs, no choice but to miss the trade.
    • It is better to take trades with limited risk rather than trades with bad risk:reward ratios.
    • If the bull / bear case is 50-50, stay out.

India, Japan and Australia have begun discussions on reducing reliance on China

An ICYMI from this week on the three countries set to discuss a trilateral Supply Chain Resilience Initiative (SCRI) to reduce dependency on China

  • No date has yet been set for initial negotiations but could come as soon as next week
  • initiative first proposed by Japan
  •  Japan is said to be in favour of launching SCRI by November

US weekly oil inventories -1632K vs -2850K expected

Weekly US petroleum inventory data

  • Prior was -4512K
  • Gasoline -3322K vs -1000K expected
  • Distillates +152K vs -1200K expected
  • Refinery utilization -0.1% vs +0.3% expected
  • Production unchanged at 10.7 mbpd
API data late yesterday:
  • Crude -4264K
  • Gasoline +4991K
  • Distillates -964K
Crude rose about 20 cents on the headlines to $42.79 per barrel. The headline isn’t as bullish as anticipated but the gasoline drawdown was larger.
US weekly oil inventories
The OPEC JMMC meeting is also taking place right now with Russia’s Novak stressing the need for full compliance.

S&P and NASDAQ index close at new record highs

Dow falls on the day

Both the S&P and NASDAQ index closed at record highs today. The gain in the S&P index from the March low has now risen over 54%. The Dow industrial average did not fare as well. It fell by -0.24% on the day. The NASDAQ index continued its surge and outperformed the other indices once again.

A look at the final numbers are showing:
  • S&P index rose 7.78 points or 0.23% at 3389.77. The close today surpassed the February 19 high close of 3386.15.  The index they also took out the high intraday level from February 19 that 3393.52. The new all-time intraday high price is 3395.06. The S&P index is now up 4.92% year-to-date
  • NASDAQ index also closed at a new record high. It moved up by 81.118 points or 0.73% to 11210.84. The intraday high price of 11230.61 is now the new all time high intraday level. The low price reached 11103.83. The NASDAQ index year-to-date is up 24.95 points
  • Dow industrial average fell -66.84 points or -0.24% to 27778.07. It’s high price reached 27891.12, while its low extended to 27668.79. The Dow industrial average is still down -2.66% on the year.
The flow funds in the US also did not benefit the small-cap Russell 2000. It fell by -1.02% on the day.
The European markets also did not do well today. Each of the major indices gave up gains and closed lower on the day led by the UK FTSE which fell by -0.83%.
US and European stock indices

European shares close lower and give up earlier gains

Major indices down across the board

The European shares are closing lower on the day after trading higher earlier. The provisional closes are showing:

  • German DAX, -0.5%. The high reached +1.0%
  • France’s CAC, -0.8%. The high reached 0.59%
  • UK’s FTSE 100, -1.0%. The high reached 0.57%
  • Spain’s Ibex, -0.8%. The high reached 1.06%
  • Italy’s FTSE MIB, -0.6%. The high reached 1.05%

Why the US dollar continues to fall

USD/JPY declines below 106.00

USD/JPY is at a six-day low as the pressure on the US dollar mounts. There is some broad-based weakness taking hold. It’s increasingly becoming the default mode in the market to sell US dollars, so long as there isn’t genuine risk aversion.
There’s nothing particularly negative for the US dollar today but there are headwinds:
  1. US election risk
  2. Lack of US stimulus will hurt relative growth
  3. Equity market valuation is richer in the US, better value elsewhere
  4. Long-term monetization/inflation worries
Here’s chart on M2 from Nordea comparing the US and Europe:
USD/JPY declines below 106.00
In the smaller picture, risk sentiment is good today and that’s good enough to undercut the US dollar.
As for USD/JPY, it’s not time to worry yet but the drop in late July is starting to look like a warning shot.
USDJPY

Berkshire Hathaway reduced J.P. Morgan stake in 2nd quarter

13F filings from Berkshire Hathaway

The latest 2nd quarter 13F filings from Berkshire Hathaway show:

  • reduced J.P. Morgan stake by 62%.
  • Exited Goldman Sachs position
  • Southwest air
  • United Airlines
  • Delta Air Lines
  • American Airlines
  • Restaurant Brands International
  • Occidental Petroleum
Other swings in positions show increased stakes in:
  • Store Capital Corp.
  • Kroger
  • Suncor energy
Reduces positions in:
  • Wells Fargo
  • J.P. Morgan
  • SiriusXM
  • PNC Bank
  • M&T Bank
  • Bank of New York Mellon
  • MasterCard
they added new positions in:
  • Gold
  • Barrick Gold
Go to top