rss

SOME WELL-KNOWN ALGORITHMIC STRATEGIES

On a broad sense most commonly used algorithmic strategies are Momentum strategies, as the names indicate the algorithm start execution based on a given spike or given moment. The algorithm basically detects the moment (e.g spike) and executed by and sell order as to how it has been programmed.

One another popular strategy is Mean-Reversion algorithmic strategy. This algorithm assumes that prices usually deviate back to its average.

A more sophisticated type of algo trading is a market-making strategy, these algorithms are known as liquidity providers. Market Making strategies aim to supply buy and sell orders in order to fill the order book and make a certain instrument in a market more liquid. Market Making strategies are designed to capture the spread between buying and selling price and ultimately decrease the spread.

Another advanced and complex algorithmic strategy is Arbitrage algorithms. These algorithms are designed to detect mispricing and spread inefficiencies among different markets. Basically, Arbitrage algorithms find the different prices among two different markets and buy or sell orders to take advantage of the price difference.

Among big investment banks and hedge funds trading with high frequency is also a popular practice. A great deal of all trades executed globally is done with high-frequency trading. The main aim of high-frequency trading is to perform trades based on market behaviors as fast and as scalable as possible. Though, high-frequency trading requires solid and somewhat expensive infrastructure. Firms that would like to perform trading with high frequency need to collocate their servers that run the algorithm near the market they are executing to minimize the latency as much as possible.

Adaptive Shortfall

Adaptive Implementation Shortfall algorithm designed for reduction of market impact during executing large orders. It allows keeping trading plans with automatic reactions to price liquidity.

Basket Trading

Basket Orders is a strategy designed to automated parallel trading of many assets, balancing their share in the portfolio’s value.

Bollinger Band

Bollinger bands strategy is a trading algorithm that computes three bands – lower, middle and upper. When the middle band crosses one of the other from the proper side then some order is made.

CCI (more…)

The war against ‘insider trading 2.0’

MUST READ

In India u can fight for Poverty or can try to stop Corruption…….But u can’t stop INSIDER TRADING-It’s our Challenge

Insider trading is a fluid concept. Until 1980, the practice was not illegal in the UK. Prior to then, tipping off favoured clients about market-sensitive company information was a stockbroker’s job description, rather than an illegal activity. Times have changed and so has the pace of financial markets.

In 2009, Samantha Bee, one of the cast members on The Daily Show, the satirical US television programme, said that “if I know about a stock’s activity the day before, it’s called insider trading. But if I know about a stock’s activity one second before, it’s called high-frequency trading.”

Now, however, Eric Schneiderman, the New York attorney-general, is waging war on what he calls “insider trading 2.0”. He is taking aim at the precise time sensitive information is delivered electronically.

Mr Schneiderman’s office is currently investigating the market data industry. In July, under pressure from Mr Schneiderman, Thomson Reuters suspended its practice of releasing consumer survey data from the University of Michigan (UoM) two seconds earlier to high-frequency trading clients who paid an additional fee. Clients paying for Thomson Reuters’ financial information terminals will continue to receive the data five minutes ahead of the general public, who have to make do with a press release. (more…)

High-frequency trading: when milliseconds mean millions

Asked to imagine what a Wall Street share-dealing room looks like and the layman will describe a testosterone-fuelled bear pit crammed full of alpha males in brightly coloured jackets, frantically shouting out bid and offer prices.

He couldn’t be more wrong. Technological advances mean that stocks are now traded digitally on computer servers in often anonymous – but heavily guarded – buildings, generally miles away from the historic epicentres of finance, meaning the brash men in sharp suits depicted in films such as the The Wolf of Wall Street have been dethroned as the kings of finance.
Computer programmers have taken their crown thanks to the code they churn out, which is able to execute trades thousands of times faster than any human. (more…)

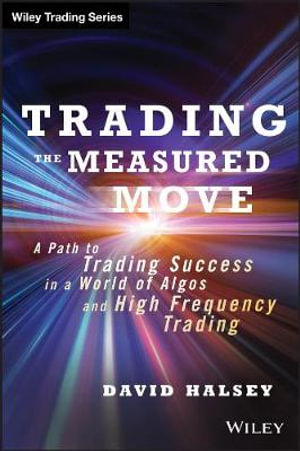
David Halsey,Trading the Measured Move -Book Review

David Halsey throws out the old notion of a measured move: that you copy an AB move up (or down) and paste it on a retracement low (or high) of C to get your price target D. In Trading the Measured Move: A Path to Trading Success in a World of Algos and High Frequency Trading(Wiley, 2014) he substitutes Fibonacci levels.

He uses three trade setups: the traditional 50% retracement measured move (MM), the extension 50% MM, and the 61.8% failure. When a trade is entered, its target is 123% from a swing high or low (and sometimes from a breakout) that is followed by a retracement (50% in the traditional setup). That is, the target is AB + 23%. Halsey shows both successful and failed MM trades on charts—unfortunately usually grey bars on a black background, which makes them hard to decipher.

The measured move trade setups are not stand-alones. Halsey discusses the use of multiple time frames, seasonality, NYSE tools, tick extremes and divergences, and gaps. He also discusses how to manage positions and take profits, advanced (actually, pretty basic) risk management, trading psychology, and having a trading plan and journal. (more…)

Trading Mathematics and Trend Following

Some quick points, to be making money, Profit Factor must be greater than 1.

  • Profit Factor (PF)
  • = Gross Gains / Gross Losses
  • = (Average win * number of wins) / (Average loss * number of losses)
  • = R * w / (1-w)
    • where R = Average win / Average loss
    • w = win rate, i.e. % number of winners compared to total number of trades

Re-arranging, we have

  • w = PF / (PF + R)
  • R = PF * (1 – w) / w

Sample numbers showing the minimum R required to break-even (i.e. PF = 1, assuming no transaction costs) for varying win rates.

  • w = 90% >> R = 0.11
  • w = 80% >> R = 0.25
  • w = 70% >> R = 0.43
  • w = 60% >> R = 0.67
  • w = 50% >> R = 1
  • w = 40% >> R = 1.5
  • w = 30% >> R = 2.33
  • w = 20% >> R = 4
  • w = 10% >> R = 9

The style of trading strongly influences the win rate and R (average winner / average loser). For example, (more…)

Michael Lewis’ Flash Boys: A Wall Street Revolt -A Remarkable Read

Michael Lewis has a spellbinding talent for finding emotional dramas in complex, highly technical subjects. He did it for the role of left tackle in American football in The Blind Side (2006), and for the science of picking baseball players in Moneyball (2003). In Flash Boys, he turns his gaze on high-frequency computerised trading in US stock markets.

In terms of sheer storytelling technique, Flash Boys is remarkable. High-frequency trading, although often in the news when things go wrong, as in the 2010 “flash crash”, is hard for a specialist to understand, let alone the average reader. It is as if a violinist, bored with the repertoire, opted to play Paganini right-handed as a challenge.

Lewis reaches a stark conclusion: US stock markets are now rigged by traders who go to astonishing lengths to gain a millisecond edge over their rivals. As the innocent investor presses a button to buy shares, they leap invisibly into electronic markets to profit from the order and thousands of others, siphoning off billions of dollars a year.

The rise of high-frequency trading (HFT) was encouraged by a regulation passed in 2005, which aimed to open large exchanges such as the New York Stock Exchange and Nasdaq to stiffer competition. The idea was to make trading fairer; it instead unleashed, in Lewis’s view and that of other critics, a tidal wave of algorithmic front-running by traders whose superfast connections to stock exchanges allow them to react to buying and selling before others can. (more…)

Trading Mathematics and Trend Following

Some quick points, to be making money, Profit Factor must be greater than 1.

  • Profit Factor (PF)
  • = Gross Gains / Gross Losses
  • = (Average win * number of wins) / (Average loss * number of losses)
  • = R * w / (1-w)
    • where R = Average win / Average loss
    • w = win rate, i.e. % number of winners compared to total number of trades

Re-arranging, we have

  • w = PF / (PF + R)
  • R = PF * (1 – w) / w

Sample numbers showing the minimum R required to break-even (i.e. PF = 1, assuming no transaction costs) for varying win rates.

  • w = 90% >> R = 0.11
  • w = 80% >> R = 0.25
  • w = 70% >> R = 0.43
  • w = 60% >> R = 0.67
  • w = 50% >> R = 1
  • w = 40% >> R = 1.5
  • w = 30% >> R = 2.33
  • w = 20% >> R = 4
  • w = 10% >> R = 9

The style of trading strongly influences the win rate and R (average winner / average loser). For example, (more…)

Go to top