rss

Can it be? Bank earnings kick off the quarterly earnings calendar next week.

It seems like only yesterday we had the last earnings cycle

Earning's for the quarter kickoff next week with financials and banks leading the charge
Can it be?
Next week bank earnings will kickoff the quarterly earnings calendar.  It seems like only yesterday that the last quarter was complete.
The thanks/financials traditionally are the first to report, but other names are in the mixed.
Some of the major releases include:
Wednesday:
  • J.P. Morgan
  • BlackRock
  • Delta Airlines
Thursday:
  • Citi
  • Domino’s pizza
  • Bank of America
  • Walgreens
  • Morgan Stanley
  • Wells Fargo
  • U.S. Bancorp
  • UnitedHealth Group
Friday:
  • Goldman Sachs
  • PNC
  • Truist
  • JB Hunt
That’s just the start, but it is the start.

Monday is a holiday in some markets

It’s Columbus day in the US and Thanksgiving in Canada

Monday is a semi-holiday in the US — Columbus day — so that will crimp activity. The CME and NYSE are open and SIFMA doesn’t recommend a bond closure. However there is no economic data on the schedule so that could keep it quiet.
In Canada it’s a different story with all markets shut for the Thanksgiving holiday.
European and Asian markets are all open but the economic calendar everywhere is light.

Major US indices close the day lower. Snap a three day win streak

NASDAQ index falls -0.5%. S&P and Dow marginally lower on the day

The major US indices are closing the day lower. The declines snapped a three day win streak for the indices.
  • Dow has best week since June
  • Major indices all closed higher for the week
  • S&P post the best week since August
  • Energy and financials lead today as oil moves higher and interest rates to move higher
A look at the final numbers shows:
  • Dow industrial average fell -8.7 points or -0.03% at 34746.24.
  • S&P index fell -8.4 points or -0.19% at 4391.35
  • NASDAQ index fell -74.47 points or -0.51% at 14579.55. That closed near the lows for the day at 14569.68.  The index was up as much as 0.31% at the highs
  • The Russell 2000 fell -17 points or -0.76% at 2233.09
For the week, the Dow industrial average led the way with a 1.27% gain
  • Dow, +1.27%
  • S&P index +0.83%
  • NASDAQ index +0.1%
Year-to-date gains show:
  • Dow +13.59%
  • S&P index +16.96%
  • NASDAQ index +13.14%

European equity close: Limp to the finish line in a turnaround week

Maybe energy isn’t dead yet

Maybe energy isn't dead yet
European stocks had a big bounce in the middle of the week when it looked like the energy fever had broken but oil has made new highs and what looked like it could be a rapid turnaround in gas has stalled (though TTF is down 10% today). The forecast for mid-October in Europe is for colder weather and low wind so that will be something to watch.
Daily changes:
  • UK FTSE +0.3%
  • German DAX -0.2%
  • French CAC -0.5%
  • Spain IBEX flat
  • Italy MIB +0.3%
Weekly changes
  • UK FTSE +1.0%
  • German DAX +0.4%
  • French CAC +0.7%
  • Spain IBEX +1.9%
  • Italy MIB +1.8%

US 10 year yield moves above 1.60% for the first time since June

Highest level since June 4

The 10 year yield has moved above the 1.600% level for the first time since June 4. The move higher pushed above the June 17 high of 1.594%. It also moved above a Topside channel trendline near 1.584%.
Highest level since June 4_
The high yield for the year came in on March 30 at 1.774%. From that high, the price trended to the downside bottoming at 1.127% on July 20. Since then the yield has increased 48 basis points..
Technically the price moved above its 100 day moving average on September 23, retested that moving average level on September 24 before starting its move back to the upside.
June 17 at 1.594% The swing low on Monday stalled ahead of the 50% midpoint at 1.450% and has been up four of the last five trading days

WTI crude oil hits $80 for the first time since 2014

WTI blasts through $80

WTI blasts through $80
The monthly chart of crude is shown above and I think it clearly illustrates how much room there is to run on this breakout, which came after four months of consolidation. The break also came right after the latest OPEC+ meeting, which offers some fundamental support along with gas-to-oil switching, which is in full swing right now. In fact, we might even see some coal-to-oil switching with inventories in India and elsewhere at unbelievably low levels.
(more…)

CAD/JPY trades to fresh highs in three months as buyers eye further upside extension

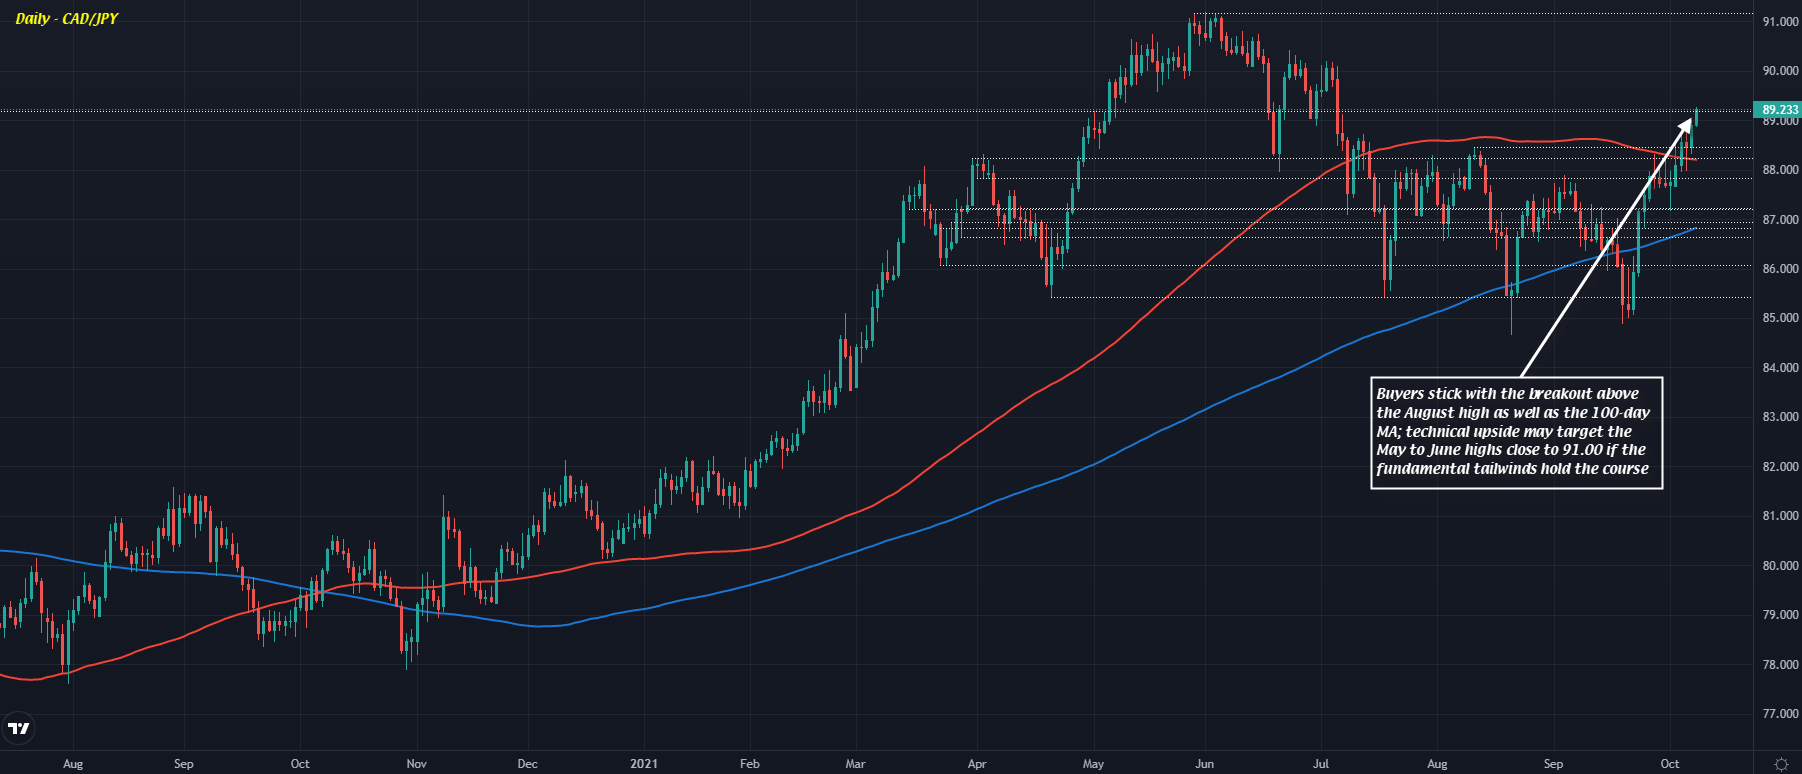
CAD/JPY trades to its highest levels since early July

CAD/JPY D1 08-10
The pair has been an interesting one to take note of from a technical perspective since August trading and after holding at the lows in late September close to 85.00, buyers have produced quite a stunning bounce higher in recent weeks.
The latest shove in the past week sees price action push past the 100-day moving average (red line) and the August high @ 88.46. That has paved the way for further gains over the past few days with buyers edging past the 89.00 level today.
So, what’s next for the pair?
From a technical perspective, it is lining up for a solid rebound potentially back towards the late-May to early-June highs close to 91.00.
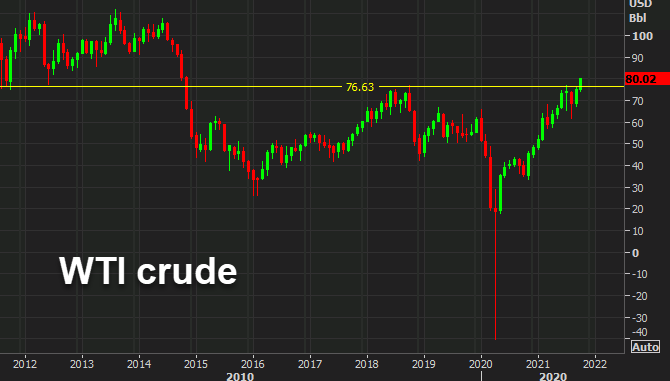
And with oil/commodity prices surging as well as a rather decent fundamental backdrop domestically, the loonie is keeping in good stead on the balance of things.
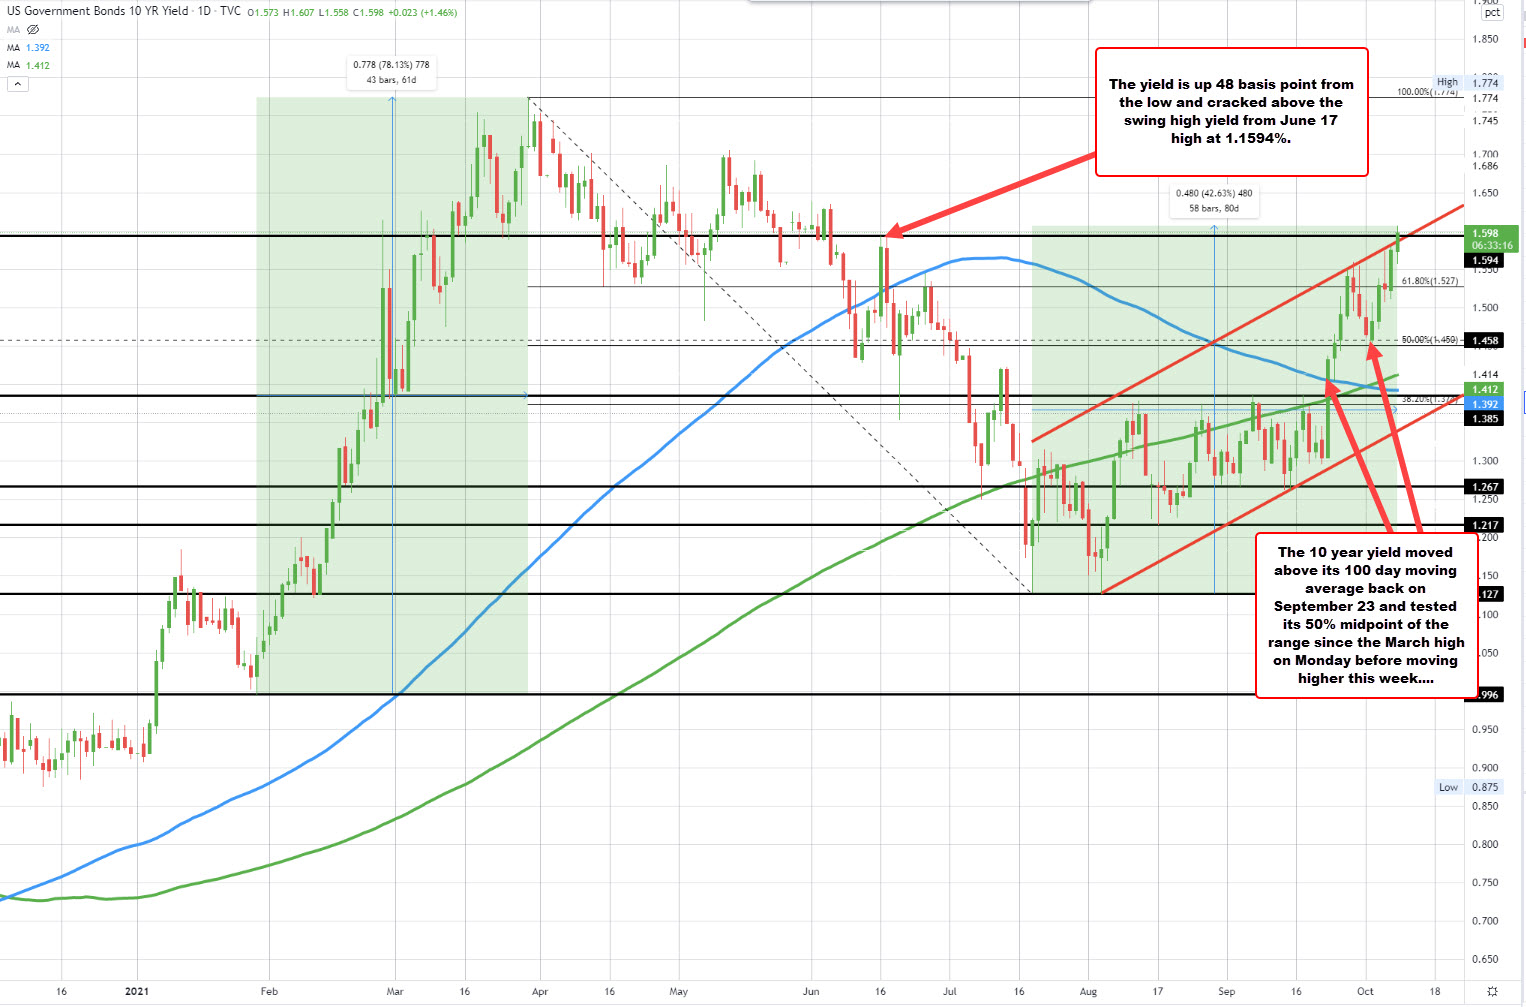
Adding to the tailwind for buyers in CAD/JPY is the surge higher in bond yields in recent weeks too. However, any further continuation of that will highly depend on today’s US jobs report for validation as we are seeing 10-year Treasury yields near 1.60%.
As such, if the fundamental factors align (especially the bond market), CAD/JPY is one to watch as it could perhaps look towards breaching the highs for the year.
It also isn’t the only yen pair that is looking for potentially more upside at this point.
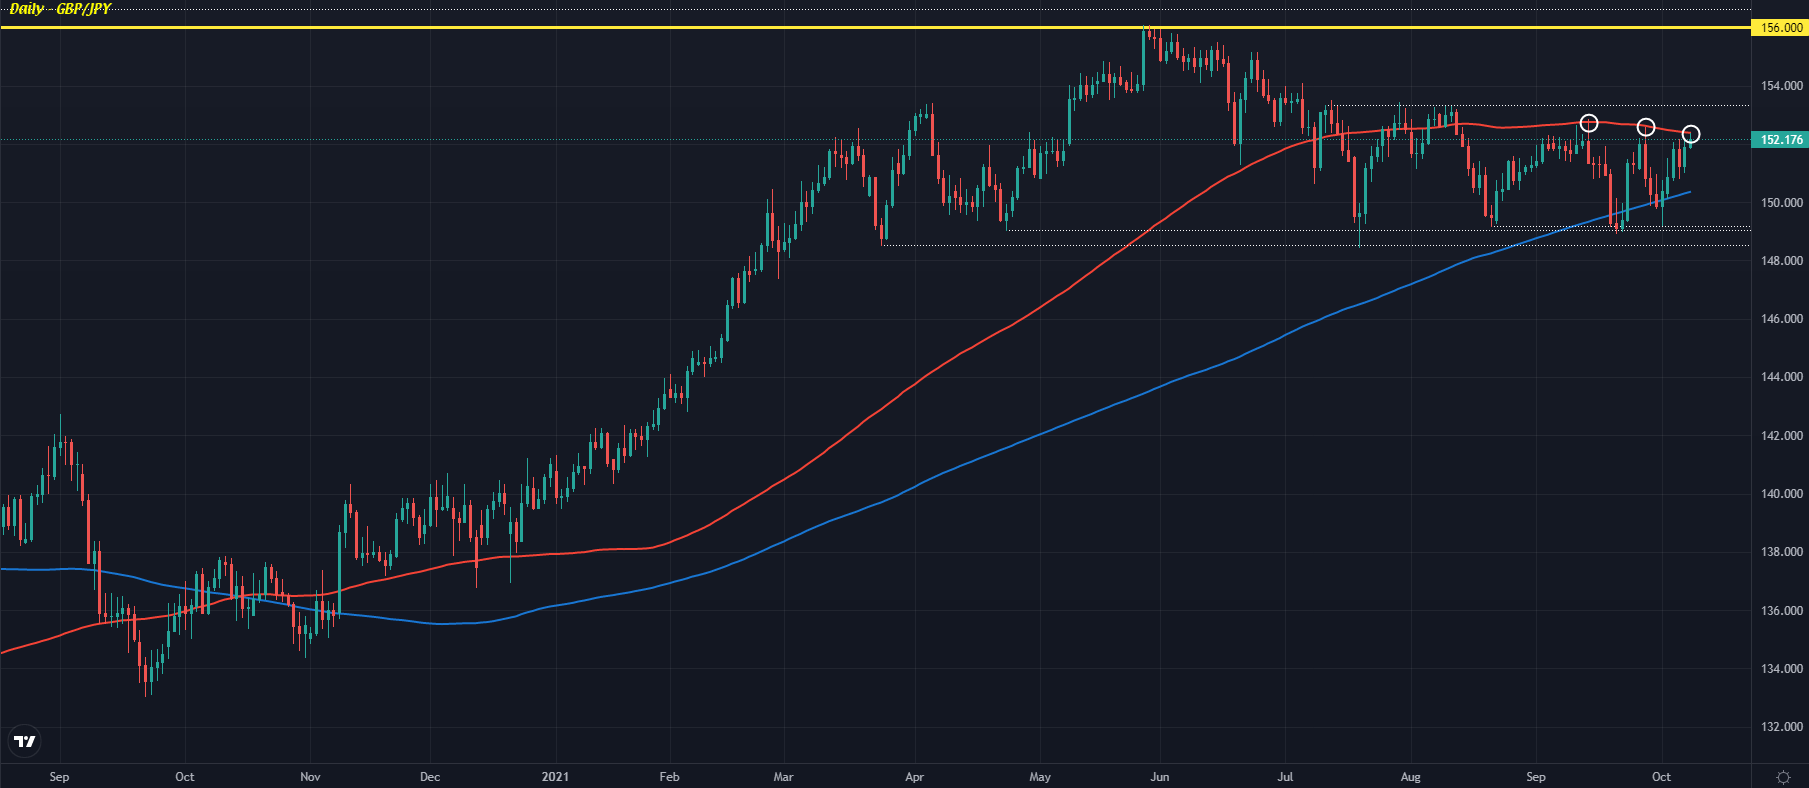
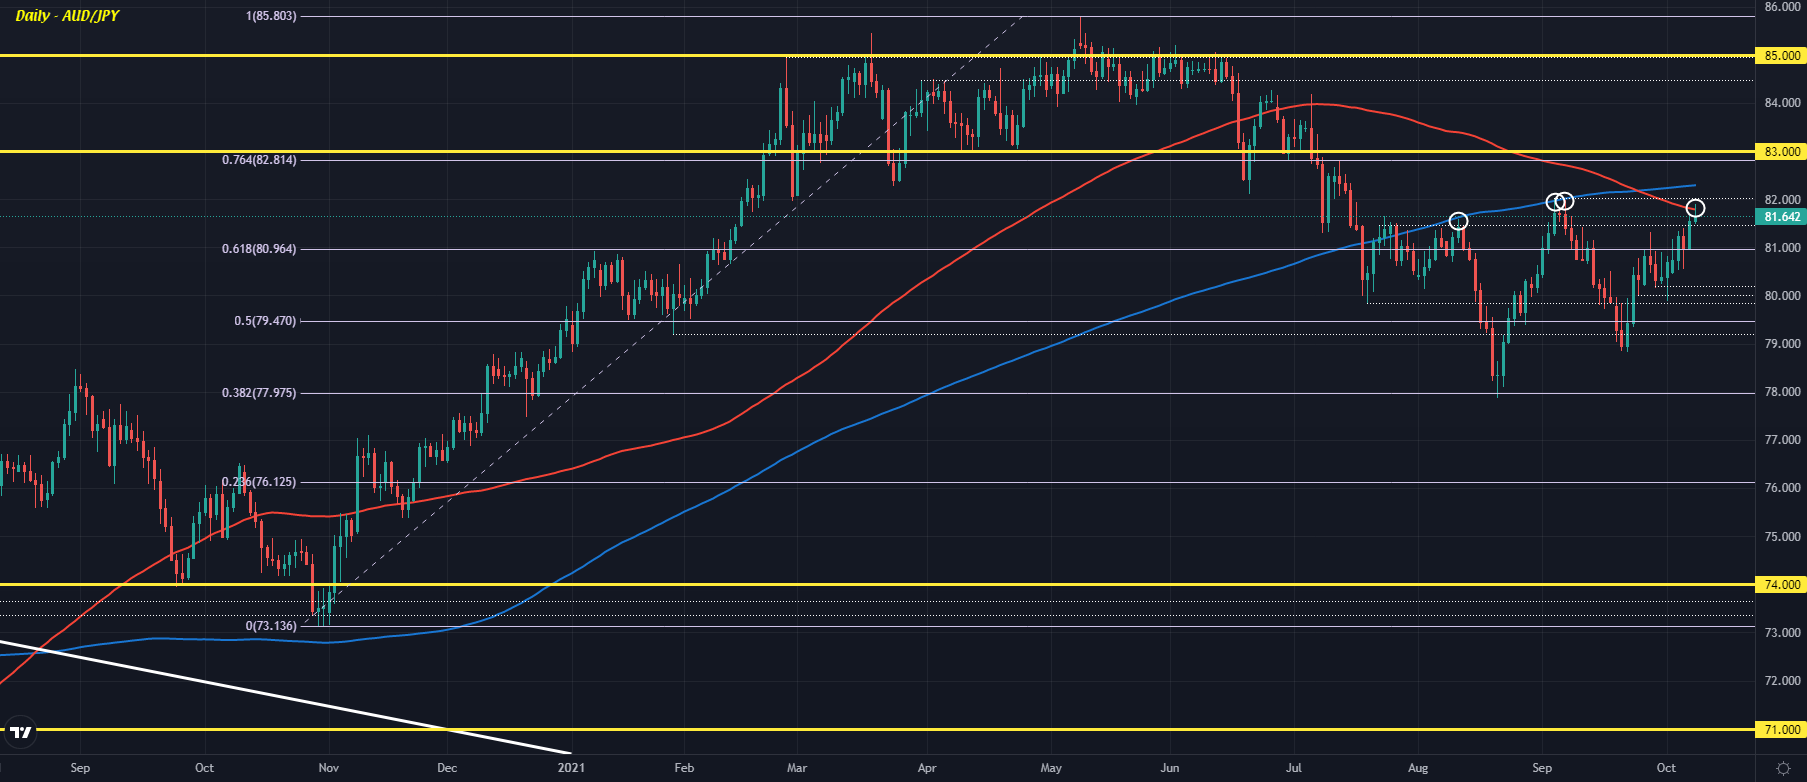
Here’s a look at GBP/JPY and AUD/JPY, which are both contesting key technical resistance from its 100-day moving averages respectively at the moment:
GBP/JPY D1 08-10 AUD/JPY D1 08-10
Go to top