rss

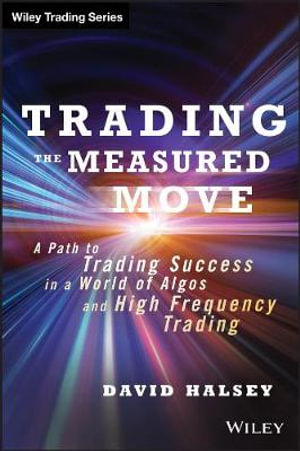
David Halsey,Trading the Measured Move -Book Review

David Halsey throws out the old notion of a measured move: that you copy an AB move up (or down) and paste it on a retracement low (or high) of C to get your price target D. In Trading the Measured Move: A Path to Trading Success in a World of Algos and High Frequency Trading(Wiley, 2014) he substitutes Fibonacci levels.

He uses three trade setups: the traditional 50% retracement measured move (MM), the extension 50% MM, and the 61.8% failure. When a trade is entered, its target is 123% from a swing high or low (and sometimes from a breakout) that is followed by a retracement (50% in the traditional setup). That is, the target is AB + 23%. Halsey shows both successful and failed MM trades on charts—unfortunately usually grey bars on a black background, which makes them hard to decipher.

The measured move trade setups are not stand-alones. Halsey discusses the use of multiple time frames, seasonality, NYSE tools, tick extremes and divergences, and gaps. He also discusses how to manage positions and take profits, advanced (actually, pretty basic) risk management, trading psychology, and having a trading plan and journal. (more…)

High Probability Trading with the Trend,Must Read These 21 points

1. Know what the trend is.
2. The best trades are made in the direction of the trend.
3. Use multiple time frames to get the overall picture of the market.
4. Assume that the main trendline or moving average will hold
5. The smaller the slope of the trendline is, the more reliable it is.
6. The longer the moving average is, the better it defines the trend.
7. Wait for the pullback
8. Don’t chase the market.
9. Don’t fight the market.
10. Even in the strongest trends there should be some retracement
11. The closer the market is to the trendline, the better the risk/reward ratio is
12. Keep it simple
13. Look for the end of a trend when the last wave doesn’t reach the channel line or the previous move.
14. Use ADX to determine the strength of the trend.
15. Hold trades longer in a strong trend.
16. When getting out in anticipation of a retracement, do not reverse a position.
17. Wait for confirmation of a trendline breaking before reversing position.
18. Watch for bubbles between moving averages.
19. Know where the Fibonacci retracements levels are.
20. Place stops outside retracement levels.
21. Estimate how much the market can move.

What to Monitor During a Correction

  • Bull market correctionReversed for bear market correction.
    • Support below
    • Fibonacci retracement levels of prior uptrend
    • Bottoming price action
    • Positive divergence — index vs. indicators
    • Positive divergence — index vs. internals
    • Bullish candlestick pattern or western reversal bar
    • Notable change in scan hits
    • Break of resistance (downward sloping) trendline

Classifying Bull Market Declines

  • 1 to 3% – Market pullback
  • 3 to 5% – Minor correction
  • 5 to 8% – Standard correction
  • 8 to 12% – Deep correction
  • 12 to 16% – Very deep correction
  • 16 to 20% – Minor bear market
  • More than 20% – Bear market
Go to top