rss

US 10-year note speculators throw in the towel, go net long

CFTC positioning data

One of the big theories on the drop in Treasury yields in the past month or so is that it was a big squeeze on shorts.
If so, it might be over.
The just-released CFTC data shows that 10-year futures positioning is now a net long of 55,987 contracts compared to a net short of 25,593 a week ago. The data are for the close on Tuesday though, and yields have continued to fall since then.
Outside of 10s, futures market specs remain short with barely anyone covering a good-sized short in 30s. There was some short covering in 2s and 5s by around 20% of the positions.
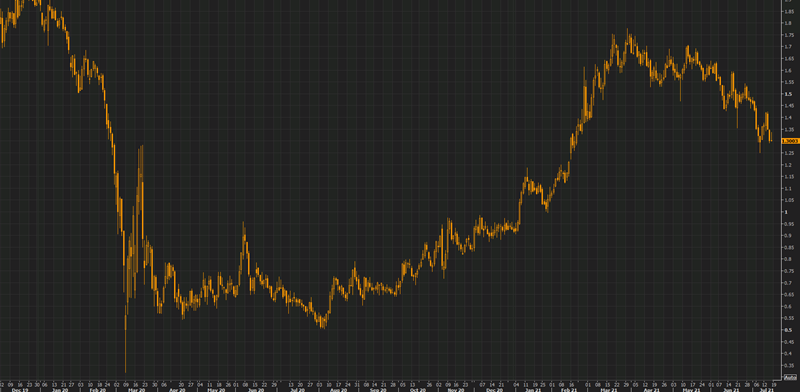
10-year yields:
CFTC positioning data

US equities close just above the lows of the week

Closing changes for the main North American indexes

  • S&P 500 -33 points to 4327, or -0.75%
  • DJIA -0.9%
  • Nasdaq -0.8%
  • Russell 2000 -1.3%
  • TSX -0.9%
I think the chart to watch is the Russell 2000. It’s been consolidating since late January and this is the worst weekly close in the index since then. The intraday lows narrowly below here are probably what matters though. If those crack, we could be in for a real beating.
SPX daily
On the week:
  • SPX -1.0%
  • DJIA -0.5%
  • Nasdaq -1.9%

US June retail sales +0.6% vs -0.4% expected

US June 2021 retail sales data

US June 2021 retail sales data
  • Prior was -1.3% m/m (revised to -1.7%)
  • Retail sales ex autos +1.3% vs +0.4% expected
  • Prior ex autos -0.7% (revised to -0.9%)
  • Retail sales control group +1.1% vs +0.4% expected
  • Retail sales ex auto and gas +1.1% vs -0.8% prior
  • Ex autos/gas/building materials/food services +1.1% vs -1.4% prior
  • Full report
Sales are up 18.0% above the June 2020 level.
Some key categories (m/m):
  • Food services and drinking places +2.3%
  • Non store retailers (online) +1.2%
  • Clothing and accessories +2.6%
  • Gasoline stations +2.5%
  • Electronics and appliances +3.3%
  • Furniture -3.6%
  • Motor vehicle and parts dealers -2.0%
The ‘food services and drinking places’ is the cleanest category to evaluate the reopening and how much of the pent up savings people will spend. The 2.3% climb follows a 3.7% rise in May and a 5.1% rise in April.
US retaurant sales m/m
Here’s another way of looking at it. You can see that it’s back on trend. What you would expect though (especially if you’re looking for a reopening boom) is an overshoot for a number of months and a burst of spending.
Go to top