rss

AUD/USD rises to fresh highs in over a month, tests key resistance level

AUD/USD runs up above 0.7400 to test its 100-day moving average

AUD/USD D1 14-10

The dollar softness in the past few days is certainly one reason for the push higher but the aussie itself is showing some resilience since dipping below 0.7200 briefly at the end of September trading.
Risk sentiment has been a bit more mixed this week but today’s more optimistic mood won’t hurt the aussie’s charm whatsoever, which I would argue has more to do with rising commodity prices in recent weeks more than anything else.
Adding to that is perhaps the technical breakout in AUD/JPY as the pair climbs to its highest since July above 84.00 currently, after having broken above key resistance levels from the September highs close to 82.00 at the start of the week.
So, what’s next for AUD/USD?
The 100-day moving average (red line) @ 0.7413 poses the first immediate resistance for now so buyers will have to try and hold a break above that to keep the upside run going. The September highs @ 0.7469-78 will then be the next key test.
In the big picture, I’m not a big fan of the aussie but the technicals are hard to ignore and considering the climbdown from 0.7700 to nearly 0.7100 since June, there has been a modest downside move played out already for the currency.
The COVID-19 situation is also likely to get better as vaccinations are inching closer towards the 80% rate for NSW and Victoria states. So, that isn’t going to pose an added threat to the outlook although economic conditions are still not the best.
In the bigger picture, I would argue that monetary policy divergence is still a key driver and with the Fed and RBA on two different sides of the spectrum somewhat, a return back towards 0.7800 to 0.8000 is likely out of the picture.
As such, fair value gains may point towards a push towards the 200-day moving average (blue line) at most on a technical break but it shouldn’t be much more than that.

Energy crisis could stoke inflation, slow global recovery – IEA

IEA remarks in its latest monthly report

  • Energy crisis has prompted a switch to oil, could boost demand by 500k bpd
  • Oil supply has resumed uptrend as OPEC+ unwinds output cuts
  • Revises 2021 oil demand forecast upwards by 170k bpd
  • Revises 2022 oil demand forecast upwards by 210k bpd
In other words, expect a tighter market going into next year with the global energy crunch likely to keep demand conditions bolstered and supportive of energy prices in general. IEA also adds that:

“Record coal and gas prices as well as rolling blackouts are prompting the power sector and energy-intensive industries to turn to oil to keep the lights on and operations humming. Higher energy prices are also adding to inflationary pressures that, along with power outages, could lead to lower industrial activity and a slowdown in the economic recovery.”

USD/CAD eases to fresh lows in over three months, closes in on 1.2400

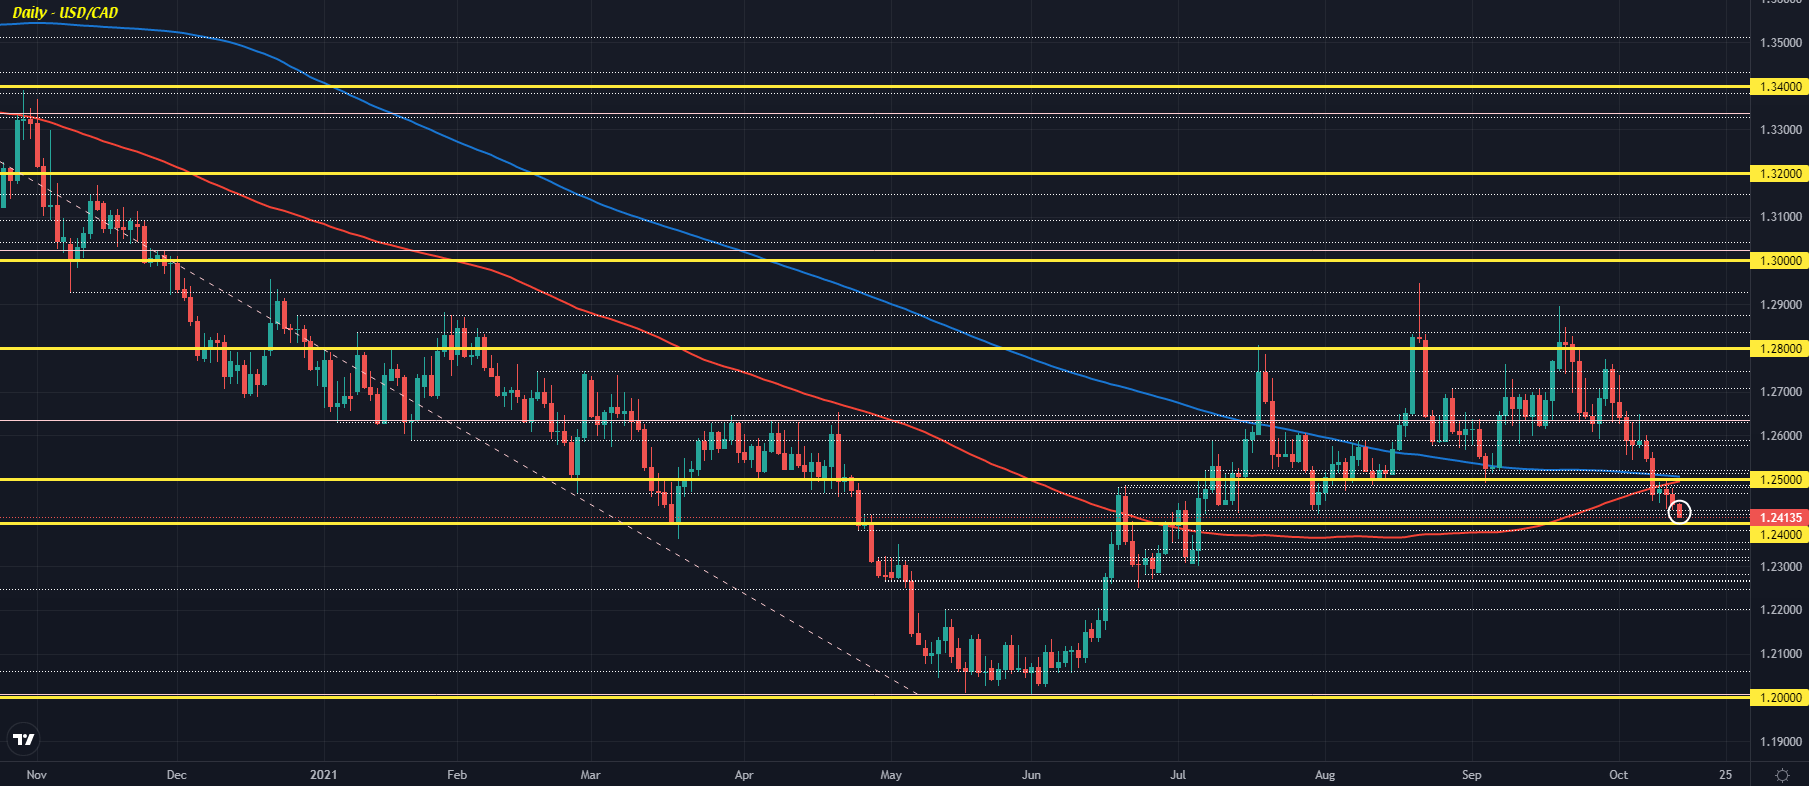
USD/CAD falls below the 30 July low of 1.2422, last seen at 1.2409

USD/CAD falls below the 30 July low of 1.2422, last seen at 1.2409

Sellers will be looking to breach 1.2400 next and there isn’t much support beyond that as the downside momentum could extend back towards the region of 1.2200 to 1.2300.
The 61.8 retracement level of the swing move higher from May to August is seen at 1.2367 so one can perhaps point to that for some minor support in the meantime.
There are a lot of good things working in favour of the loonie lately but surging oil prices continue to be the most obvious catalyst. WTI is trading back up above $81 today, 0.8% higher, and that continues to keep the currency underpinned.
Meanwhile, the dollar is not looking too hot despite rising wage pressures from yesterday’s US CPI report so there’s that to consider when weighing sentiment this week.
I’d still argue that the loonie is still favoured for further gains at this stage and CAD/JPY is also another key pair to watch as it climbs to its highest since January 2018 and closes in on key resistance around 91.58-64 at the moment.

Binance cryptocurrency exchange to stop offering peer-to-peer trading in China by the end of 2021

Binance, is the world’s largest cryptocurrency exchange.

News was out overnight so posting as an ICYMI, not breaking or anything.
Binance will stop offering its peer-to-peer trading service in China by the end of 2021
  • The firm largely withdrew from doing so years ago but this will finalise it.
  • “in response to regulatory and policy demand”, the company said
  • comes after the People’s Bank of China (PBOC) warned recently that any foreign cryptocurrency exchange that provides services to Chinese citizens through the internet is engaged in illegal financial activities.
Info comes via the South China Morning Post which adds as an explainer:
  • The peer-to-peer service has enabled mainland China residents to buy and sell digital currencies bilaterally using fiat currencies such as the yuan, even though Binance all but quit China in 2017 after the government cracked down hard on cryptocurrency exchanges that year.
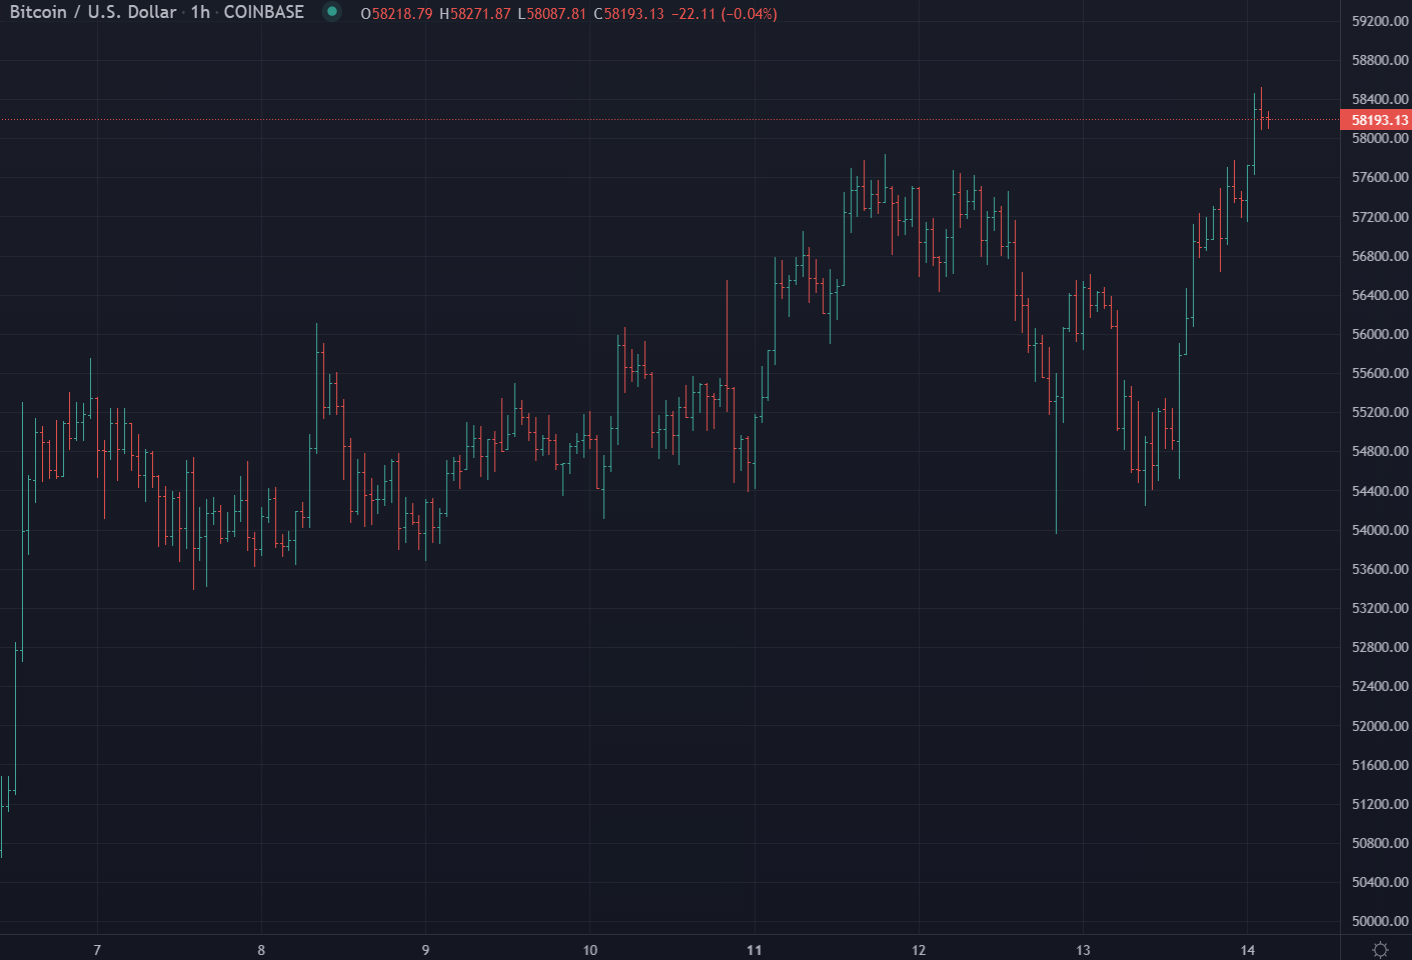
And, an update on BTC – has had a solid gain
Binance, is the world’s largest cryptocurrency exchange.

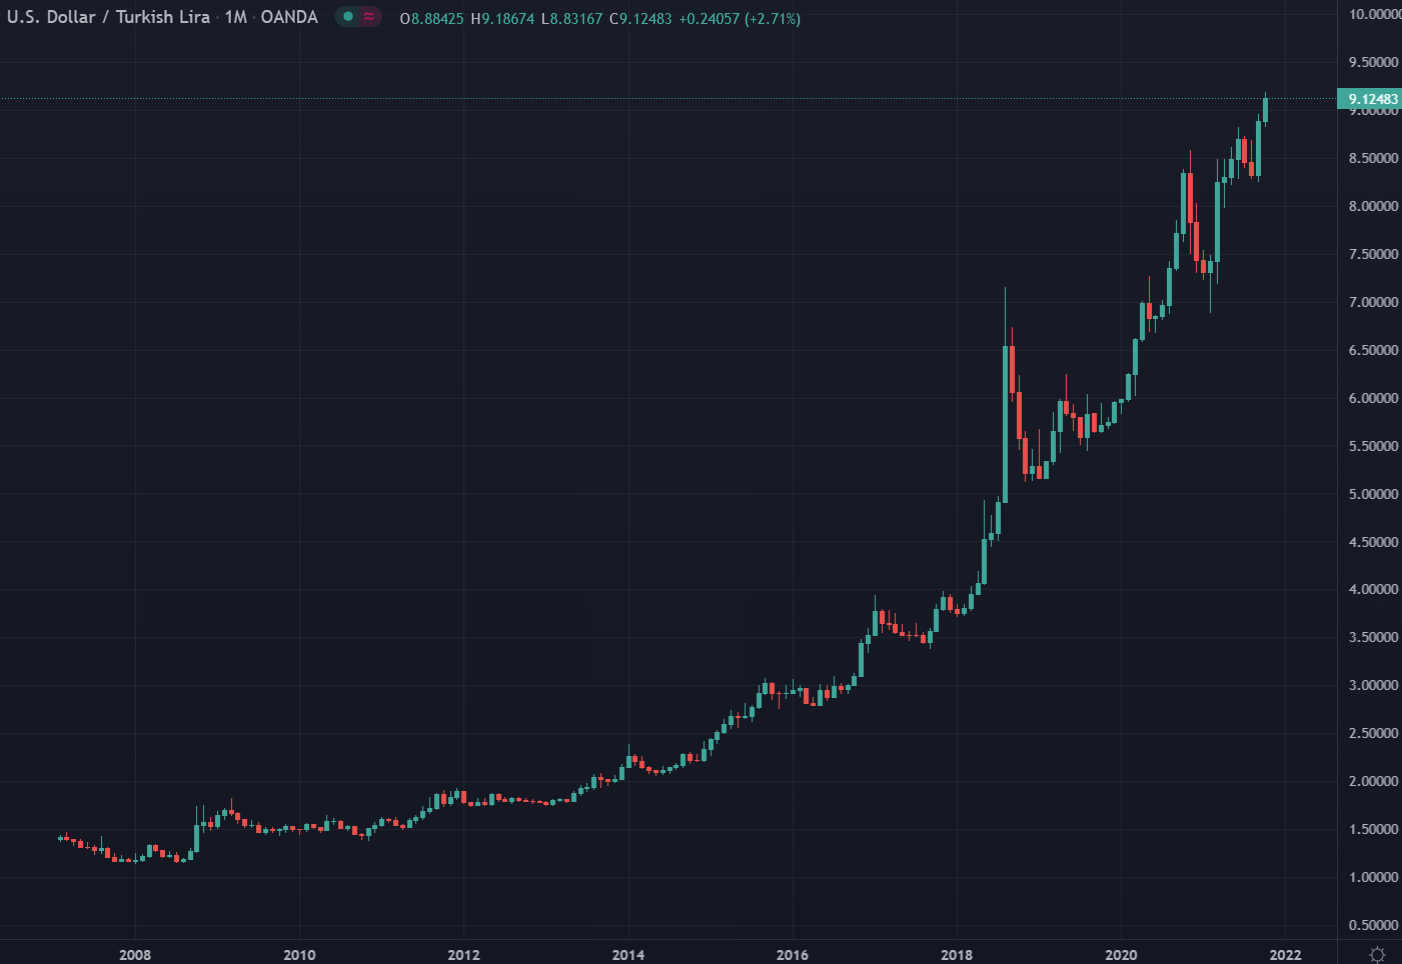
Turkish lira (TRY) to its lowest ever in the wake of President Erdogan sacking more central bank officials

Erdogan has fired members of the Bank’s monetary policy committee before, including the Governor. Erdogan’s prescription for lowering the inflation rate is to cut interest rates. Which is directly opposite to (well reasoned) orthodoxy.
Turkey’s central bank has zero credibility on policy. TRY has been reflecting such for a good long while. Monthly candles of USD/TRY :
News from the central bank in Turkey is here from earlier:   

S&P and NASDAQ breaks three-day losing streak

Dow closes lower for the fourth day in a row

The Dow industrial average could not sustain gains into the close and is closing fractionally lower on the day. Nevertheless it still is a down day. That increases the losing streak for the Dow industrial average to four consecutive days.

The good news is that the S&P and the NASDAQ both closed higher snapping their three day decline.

The final numbers are showing:
  • Dow industrial average -0.55 points or -0.00% at 34377.82
  • S&P index +13.15 points or 0.3% at 4363.79
  • NASDAQ index +105.71 points or 0.73% at 14571.64

FOMC minutes: Fed staff outlined $15B/month taper path

Highlights of the FOMC minutes:

  • Four mentions of transitory inflation, including “staff continued to expect that this year’s rise in inflation would prove to be transitory”
  • 8 mentions of tapering, including an outline of the path
The illustrative tapering path was designed to be simple to communicate and entailed a gradual reduction in the pace of net asset purchases that, if begun later this year, would lead the Federal Reserve to end purchases around the middle of next year. The path featured monthly reductions in the pace of asset purchases, by $10 billion in the case of Treasury securities and $5 billion in the case of agency mortgage-backed securities (MBS). Participants generally commented that the illustrative path provided a straightforward and appropriate template that policymakers might follow, and a couple of participants observed that giving advance notice to the general public of a plan along these lines may reduce the risk of an adverse market reaction to a moderation in asset purchases. Participants noted that, in keeping with the outcome-based standard for initiating a tapering of asset purchases, the Committee could adjust the pace of the moderation of its purchases if economic developments were to differ substantially from what they expected. Several participants indicated that they preferred to proceed with a more rapid moderation of purchases than described in the illustrative examples.

Left-for-dead commodity rallies are coming back to life

Lumber and natural gas in focus

Cathie Wood’s favorite recent commodity chart is lumber. Her and other commodity bears have been overlaying it with other commodities in a hackneyed attempt to show that every spike will result in a bust.
In general, chart overlays are bad practice if they’re not highly correlated assets over the long term. But they’re a favorite of those looking for attention.
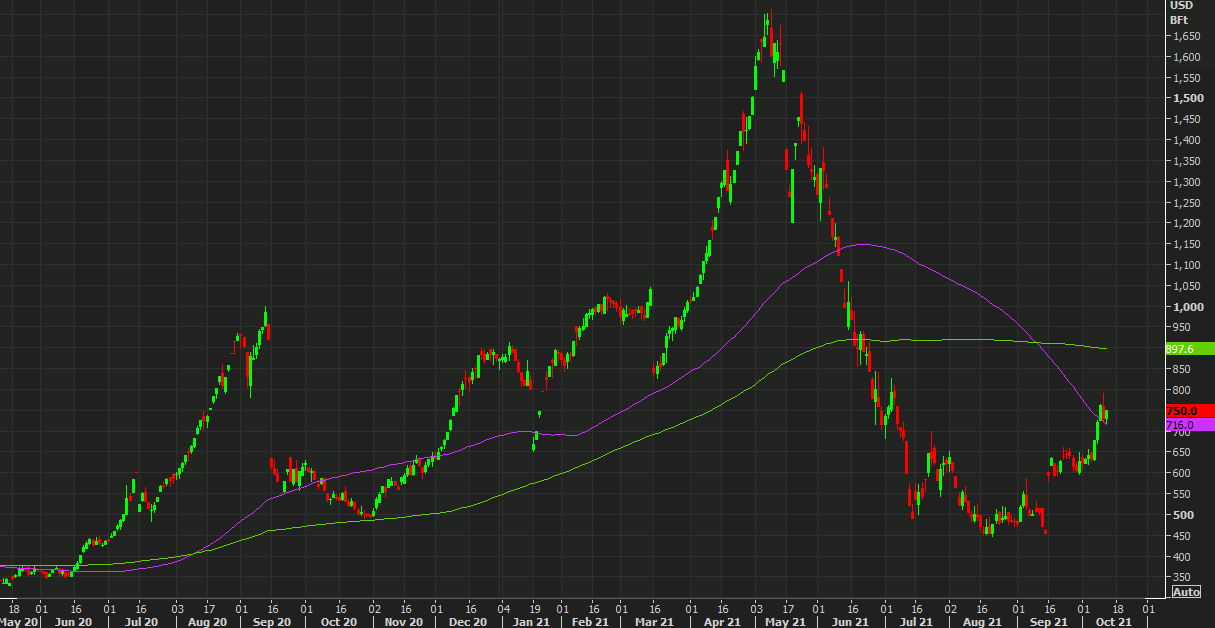
The thing is, while lumber has been used as a market to foreshadow all others (don’t get me started on iron ore, which is about Chinese policy) the latest trend in the price of trees is higher. Lumber futures are back up to $750 from an August low of $482.
lumber prices
The futures market in lumber is extraordinarily thin but cash prices have also made a move to the upside, with the latest pricing around $580 and rising 4.5% since last Friday. Random Lengths pointed to to upward momentum across grades as consumption outpaced production though noted that buyers remained cautious. But if you factor in yesterday’s call from Goldman Sachs for a multi-year boom in US housing and there is plenty to like.
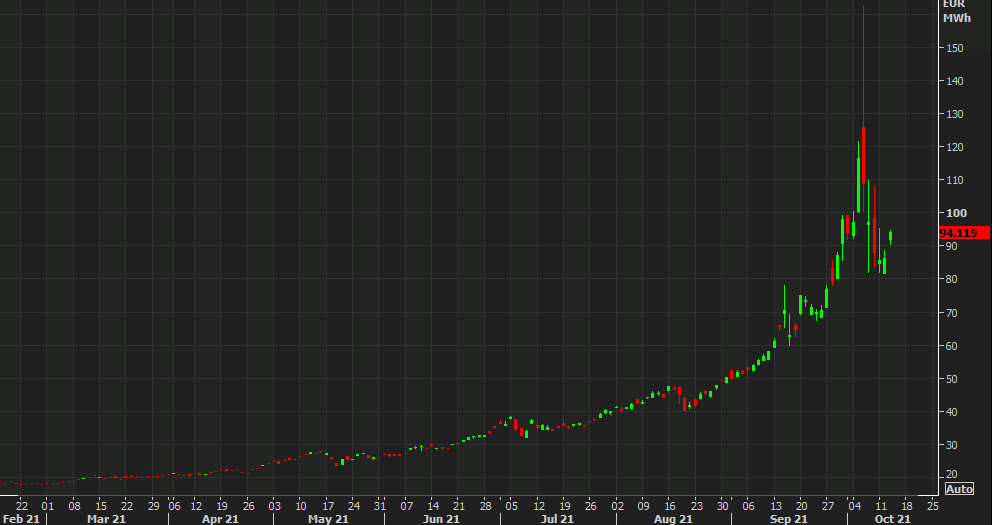
A commodity at a different stage of a boom is European natural gas. To me and everyone else, the price action on October 6 looked like a blowoff top. However TTF prices made a low the following day but haven’t declined or hit a new low since. They’re up 10% today on forecasts for colder weather and lighter wind.

TTF prices

Go to top