

September 2021 FOMC meeting results.
Dot Plot for September 2021:
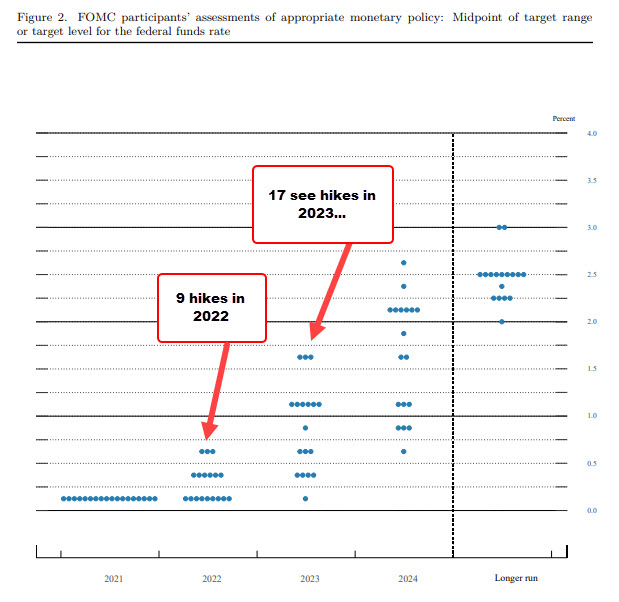
The dot plot for the September 2021 FOMC meeting shows:
- 0 Fed officials see hikes in 2021 versus zero in the June meeting
- 9 Fed officials see hikes and 2022 vs 7 in the June meeting. The most hawkish see the rate rising to 0.75% versus 0.75% in June
- 17 Fed officials see hikes in at 2023 versus 13 in the June meeting. The most hawkish see the rate rising to 1.75% vs 1.75% you
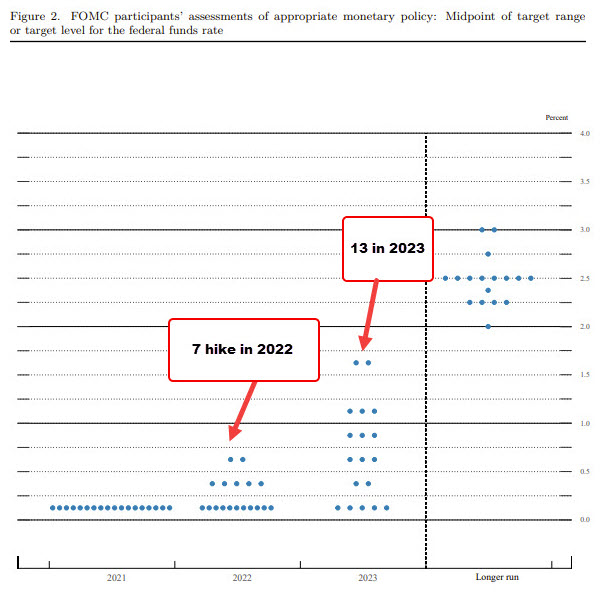
Below is the dot point from the June meeting. At the time seven Fed officials expected rate hikes in 2022 and 13 Fed officials saw hikes in 2023.
Central tendencies September 2021
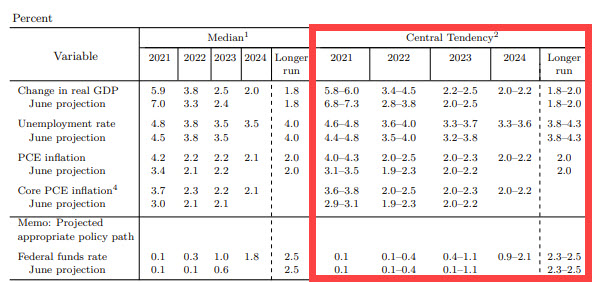
Central tendencies for 2021:
- GDP 5.8 % to 6.0 % vs. 6.8% to 7.3% in June. Lower versus June
- Unemployment rate 4.6% to 4.8% vs 4.4% to 4.8% in June. Unchanged to marginally higher
- PCE 4.0% to 4.3 % vs. 3.1% to 3.5% in June. Much higher than June
- Core PCE 3.6% to 3.8% vs 2.9% to 3.1% in June. Much higher than June
Central tendencies for 2022:
- GDP 3.4% to 4.5% versus 2.8% to 3.8 percent in June. Much higher than June’s expectations
- unemployment 3.6% to 4.0% versus 3.5% to 4.0% in June. Near unchanged versus June
- PCE 2.0% to 2.5% versus 1.9% to 2.3% in June. Higher and above the 2% target
- Core PCE 2.0% to 2.5% versus 1.9% to 2.3% in June. Higher and above the 2% target
Central tendencies for 2023
- GDP 2.2% to 2.5% versus 2.0% to 2.5% in June. GDP higher marginally
- Unemployment rate 3.3% to 3.7% versus 3.2% to 3.8% in June. Unemployment no change
- PCE inflation 2.0% to 2.3% versus 2.0% to 2.2% in June. Little change in PCE inflation projections
- Core PCE 2.0% to 2.3% versus 2.0% to 2.2% in June. Little change in core PCE