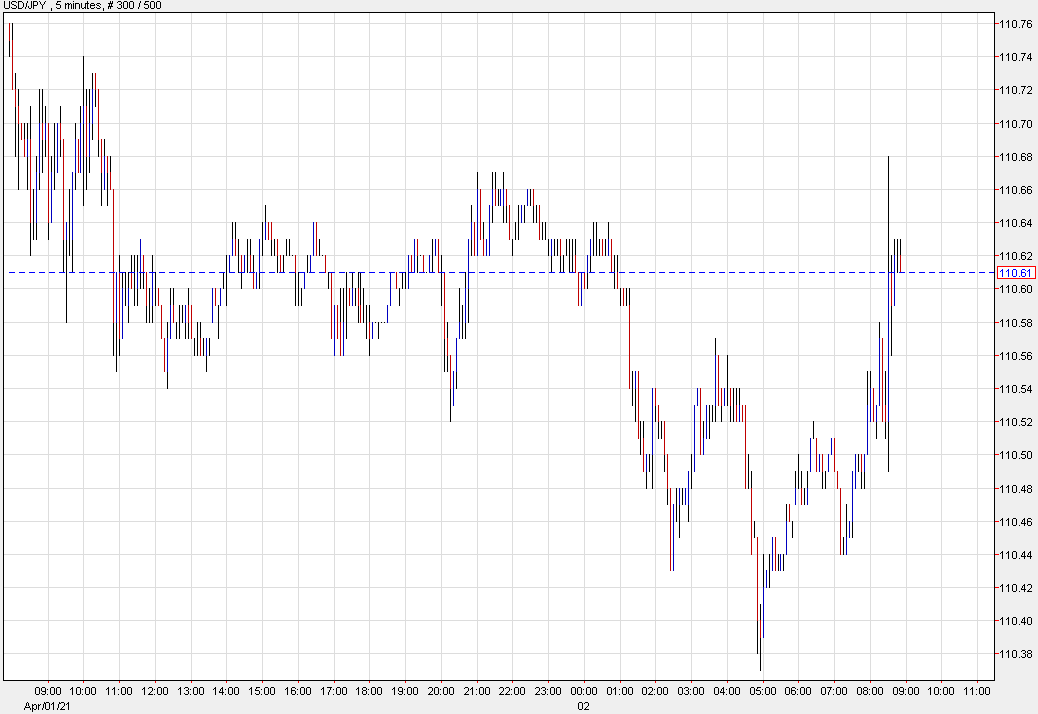
The Yen – maximum leverage for hedge funds – reversed yesterday, implies they were leveraging out the US Dollar?? Stocks??? Everything has extreme moves with this economy


13 Insights From Paul Tudor Jones
1. Markets have consistently experienced “100-year events” every five years. While I spend a significant amount of my time on analytics and collecting fundamental information, at the end of the day, I am a slave to the tape (and proud of it).
2. Younger generation are hampered by the need to understand (and rationalize) why something should go up or down. By the time that it becomes self-evident, the move is over.
3. When I got into the business, there was so little information on fundamentals, and what little information one could get was largely imperfect. We learned just to go with the chart. (Why work when Mr. Market can do it for you?)
4. There are many more deep intellectuals in the business today. That, plus the explosion of information on the Internet, creates an illusion that there is an explanation for everything. Hence, the thinking goes, your primary task is to find that explanation.
As a result of this poor approach, technical analysis is at the bottom of the study list for many of the younger generation, particularly since the skill often requires them to close their eyes and trust price action. The pain of gain is just too overwhelming to bear. (more…)
1. Take the Global View: Use a spreadsheet to track your total net worth — not day-to-day price fluctuations.
2. Hope for the best, but expect the worst: Brace for disaster via diversification and learning market history. Expect good investments to do poorly from time to time. Don’t allow temporary under-performance or disaster to cause you to panic.
3. Investigate, then invest: Study companies’ financial statement, mutual funds’ prospectus, and advisors’ background. Do your homework!
4. Never say always: Never put more than 10% of your net worth into any one investment.
5. Know what you don’t know: Don’t believe you know everything. Look across different time periods; ask what might make an investment go down.
6. The past is not prologue: Investors buy low sell high! They don’t buy something merely because it is trending higher.
7. Weigh what they say: Ask any forecaster for their complete track record of predictions. Before deploying a strategy, gather objective evidence of its performance.
8. If it sounds too good to be true, it probably is: High Return + Low Risk + Short Time = Fraud.
9. Costs are killers: Trading costs can equal 1%; Mutual fund fees are another 1-2%; If middlemen take 3-5% of your cash, its a huge drag on returns.
10. Eggs go splat: Never put all your eggs in one basket; diversify across U.S., Foreign stocks, bonds and cash. Never fill your 401(k) with employee company stock.