Archives of “April 2020” month
rssEurozone March final manufacturing PMI 44.5 vs 44.8 prelim
Latest data released by Markit – 1 April 2020
The preliminary report can be found here.
Nikkei 225 closes lower by 4.50% at 18,065.41
A rough day for Japanese stocks, particularly in the closing hour

Asian equities have turned more sour as the risk mood softens ahead of European trading today. It is a new month and new quarter, so fresh flows and sentiment will be evident after talk of re-balancing action over the past week.
Concerns of the virus outbreak becoming more widespread in Japan and the continued economic fallout globally is stoking fears among investors it seems.
The Hang Seng is down by over 2% while Chinese equities have also seen earlier gains – largely on the back of stimulus hopes – fade with the Shanghai Composite also down at the lows now, falling by 0.3% going into the final hour of trading.
US futures are down by over 3% currently and that is setting a bit of a softer tone to start the session. USD/JPY is keeping a little lower at 107.36 as such.
The cash economy still lives in case anyone forgot.
The biggest bubble in the history of the world…
The bond market. Currently, the bond market has the lowest yields in 120 YEARS! I guess the big complaint on #gold not having any yield is vanishing just like your savings via inflation!

BOJ Tankan, business sentiment plummets
The Tankan is a survey conducted by the Bank of Japan
Woeful results, hitting multi year lows from manufacturers and non-manufacturers alike
- Large manufacturers index hits its lowest since March of 2013 at -8
- Large non-manufacturers index falls to its lowest reading since March 2013 at +8
- Small non-manufacturers’ sentiment worsened for 2 straight quarters, hit worst level since December 2014, index at -1
- Small manufacturers’ sentiment worsened for 5th straight quarter, hit worst level since March 2013, index at -15
As part of the survey firms are asked on their outlook for coming months, also a bleak picture, as you’d expect given the virus outbreak impact:
- big manufacturers index three months ahead seen at -11
- big non-manufacturers index three months ahead seen at -1
More:
- big firms see capex +1.8% this fiscal year
- small firms see capex -11.7%
Fund manager Gundlach says the current economy looks like a depression
Jeffrey Gundlach is the founder of DoubleLine Capital
Speaking on his regular webcast
- says the current economy looks like a depression
- band projections on recovery are too optimistic
- 35 million lower-paying jobs are at risk
- Not plausible that Q3 will reverse Q2 economic drop
- March low in stock market likely to be taken out
I am sure there will be more to come

USDJPY has the largest trading range since November 2016
A trading range of 1052 pips
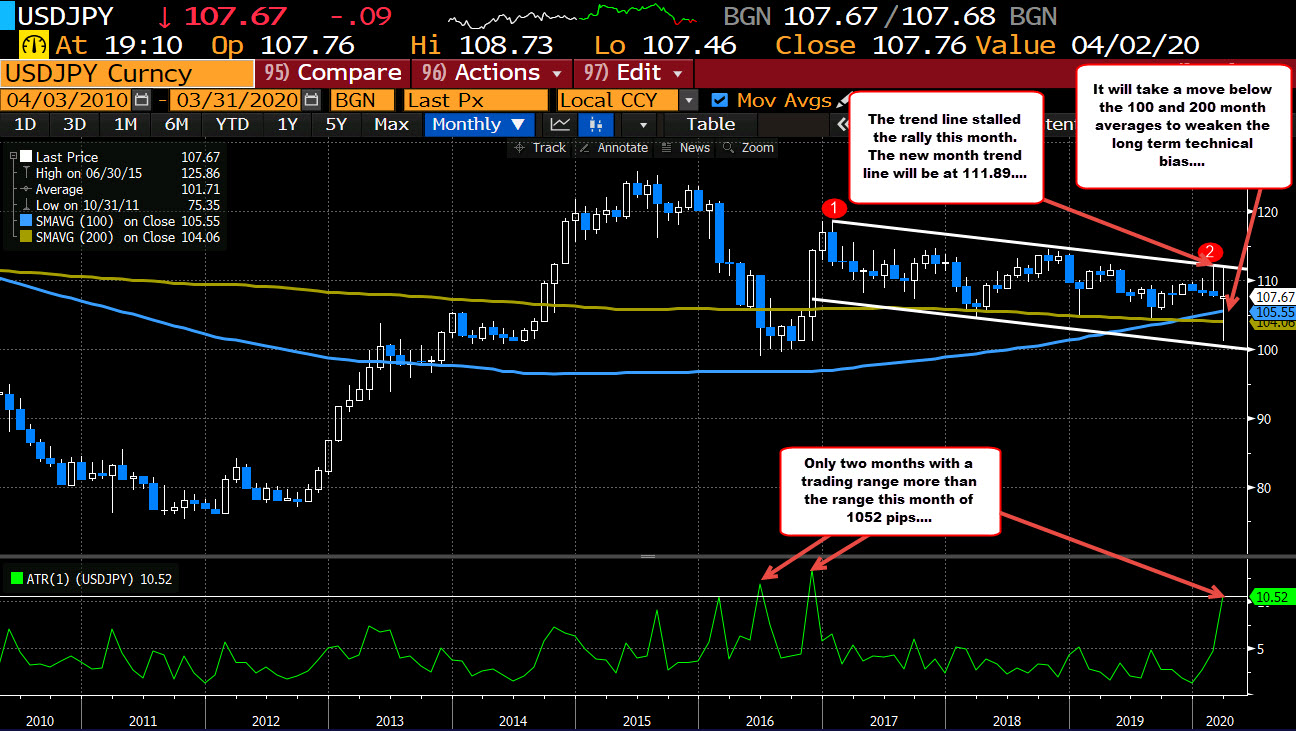
The USDJPY is finishing up a month where the low to high trading range has totaled 1052 pips. That is the 3rd highest range going back 10 years and the highs in trading range since November 2016 (US election month). The total range for 2019 was 939 pips. So one month, the range was bigger than one year.

Looking at the monthly chart above, the high for the month stalled near the high from last month and a trend line connecting the 2017 high and the high from February. That trend line cuts across at 112.06. The high for the month reached 111.71. Stay below, helped put a stall in the rallly. In the new month that trend line will cut across at 111.89, and a move above will be needed to give buyers more upside confidence.
On the downside this month, the price moved below the 100 month (at 105.55) and 200 month MA (at 104.06) after testing the MA twice in 2019 and bouncing. In 2018, there was two intra-month dips below the MA, but no closes below that MA level.
This month will also not close below the 200 month MA again (it has not closed below the MA since October 2016), but it did seriously break the MA in the month. The sellers had their shot to send the pair lower and weaken the technical bias from a longer term perspective, but they failed.
In the new month, it will take a move back below those monthly moving averages to hurt the longer term technical picture.
Dow leads the decline in stocks. Dow posts worst Q1 ever.
Dow & S&P worst month since 2008. S&P falls -20% for the quarter. All indices are in the red going back a year.
The US stocks are ending the day with declines across the board but by differing degrees.
For the month, the Dow and S&P had the worst month since 2008. The Dow posted the worst Q1 ever. The S&P fell an even -20.00% for the quarter (which is a bit ironic).
The final numbers are showing:
- S&P index fell -42.06 points ro -1.6% at 2584.59
- Nasdaq index fell -74.05 points or -0.95% at 7700.10
- Dow index fell -410.32 points or -1.84% at 21917.16
For the month, the major indices are showing:
- S&P index fell -12.51%
- NASDAQ index fell -10.12%
- Dow fell -13.74%
For the quarter, the final numbers for the 1Q are showing:
- S&P index fell -20.00%
- NASDAQ index fell -14.18%
- Dow fell -23.2%
Going back 1 year, all the major indices are now showing declines
- S&P index, -8.81%
- NASDAQ index, -0.38%
- Dow industrial average, -15.47%