rss

China cuts RRR by 50 basis points

PBOC lowers required reserve ratio

PBOC lowers required reserve ratio
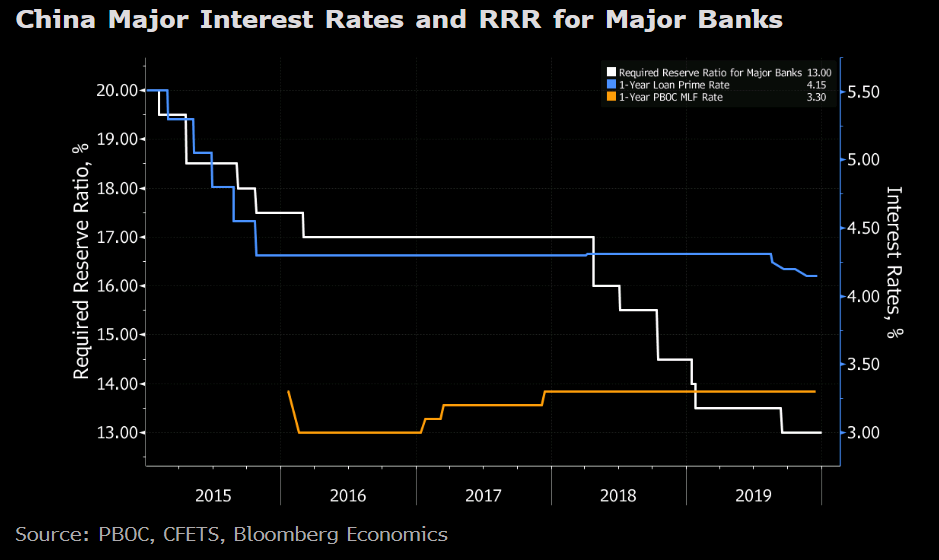
It took only hours into the New Year for the PBOC to deliver. The central bank announced a 50 basis point cut in the required reserve ratio, effective January 6.
The move will unleash about $115 billion in liquidity by lowering reserves to 12.5% for large banks and 10.5% for smaller ones. The aim is to increase lending and lower costs for business.
The PBOC often cuts rates before the holidays late in January and the statement hints at more action. The main policy rate in China is now the Loan Prime Rate and a 20-30 bps cut to just below 4% will likely come before long.
The cut will likely provide a jolt to Chinese markets to start the year and that may spread to the rest of the world.

Currencies 2019: “The Year of Low Volatility”

Record low ranges for many of the major currency pairs

If I were to name the currency year, it would be “The Year of Low Volatility”.
Three of the currency pairs had low to high trading ranges that were the lowest since 1980. Even the GBPUSD which had alll the Brexit goings on, had a relatively low range year (the 5th lowest since 2000).
If the low ranges are indicative of non-trending, the good news is non-trending transitions to trending. As a result, I would expect a more volatile/larger trading range for 2020 for many of the currency pairs. Keep that thought in mind in 2020.

Below are the graphical historical ranges for the major currency pairs versus the dollar along with comments about each. .

EURUSD.

The EURUSDh had the lowest trading range going back to 1980
The low to high trading range for the EURUSD in 2019 could only extend to 691 pips.  That was the lowest range going back to 1980. The prior low was 883 pips back in 1996.  In 1997, the range rose to 2280 pips.

The low for the year reached 1.0879. The high for the year was up at 1.1570. The pair is 347 pips or so off the low price and 344 pips off the high price. That puts the pairs price smack dab in the middle of the trading range for the year.  Which way do we tilt in 2020?
GBPUSD

(more…)

S&P, Nasdaq have best year since 2013

Nasdaq up over 35% on year

The US stock market is closed for the year, and oh what a year it was.
The S&P index and the NASDAQ index both had their best years since 2013. The NASDAQ index led the way for the year with a gain of 35.23%. The S&P index rose by 28.87%. The Dow industrial average was limited with a 22.33% gain. Boeing weighed on that index in 2019.
For the day, the major indices are closing near highs:
  • S&P index rose 9.41 points or 0.29% to 3230.70
  • NASDAQ index rose 26.611 points or 0.30% to 8972.60
  • Dow rose 76.1 points or 0.27% to 28538.24
Globally for the year, the Nasdaq index was the largest gainer (+35.23%) followed by the S&P index (+28.88%) and Italy’s FTSE MIB (up 28.28%).  The Shanghai composite index had a impressive 22.1% return.  France’s Cac and Germany’s DAX rose 26.37% and 25.48% respectively.
The worst performing index was the Portuguese PSI20 at 10.20% and Spain’s Ibex at 11.82%.  The UK FTSE, with all the upheaval and uncertainty from Brexit and the political upheaval, had a limited (relatively) gain of 12.10%.
The YTD returns were impressive in 2019
Go to top