Central tendencies and dot plot for June 2020
The last time the central tendencies and dot plot was released was way back in December 2019. At that time, the world was different place.
At the time in December, the Central tendencies saw 2020 numbers at:
- GDP 2.2%
- unemployment rate 3.5%
- PCE inflation 1.9%
The 2021 projections saw:
- GDP 1.9%
- unemployment 3.6%
- PCE inflation 2.0%
The projection for the Fed funds rate at the end of 2020 was 1.6%. For 2021 the rate rose to at 1.9% with the 2022 rate at 2.1%.
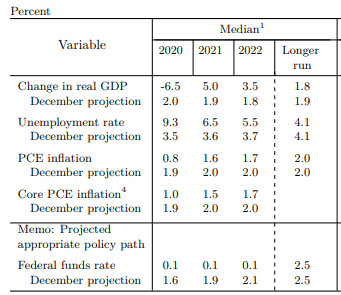
The current median estimate for central tendencies shows 2020 numbers at:
- GDP -6.5%
- unemployment 9.3%
- PCE inflation 0.8%
The projections for the Fed funds rate at the end of 2020 comes in at 0.1%. For 2021 the rate targets 0.1% with the 2022 rate targeted also at 0.1%.
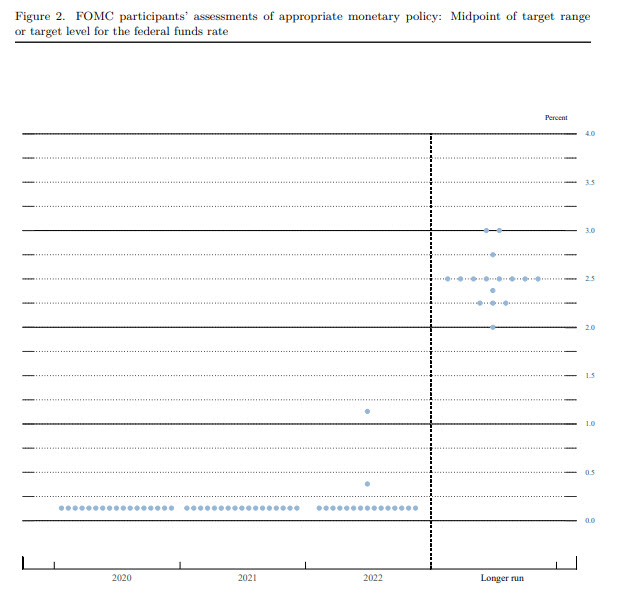
Below is the chart of central tendencies from the Federal Reserve
Below is the dot plot with all participants keeping the rate at 0.1%. In 2022, there are two voting members to forecast day higher rate. The market was looking for the Fed to keep rates low through 2022