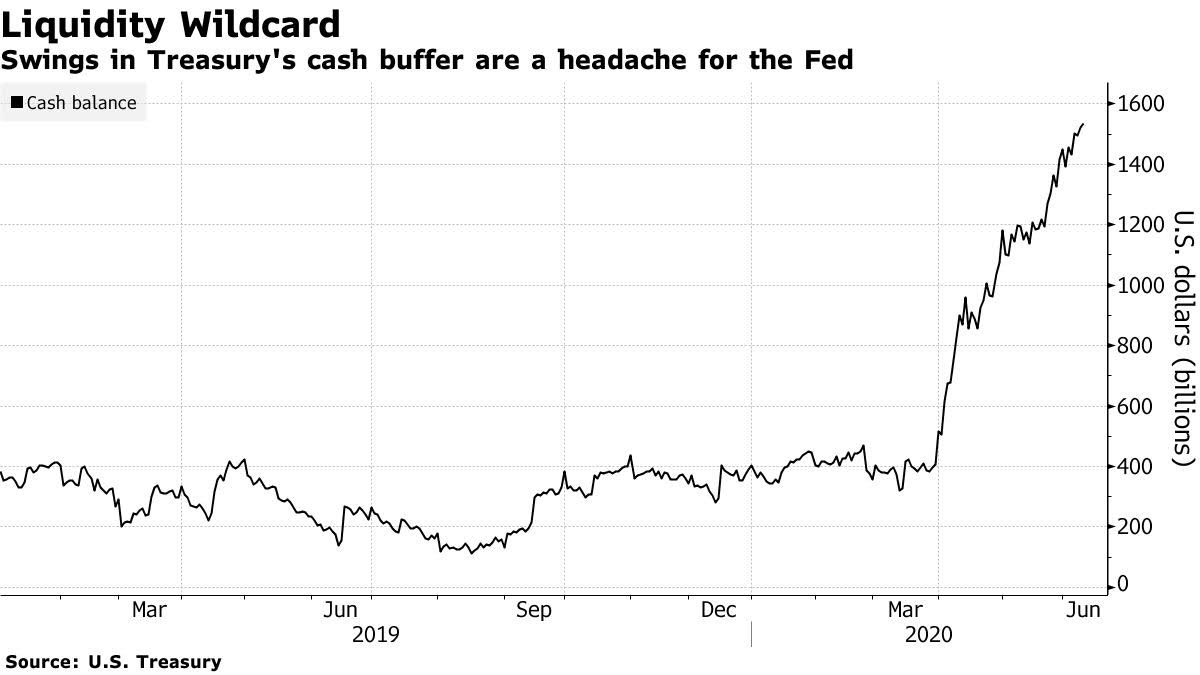
rss

FOMC central tendencies and dot plot for projected rates. Fed projects rates to remain at current levels through 2022.

Central tendencies and dot plot for June 2020

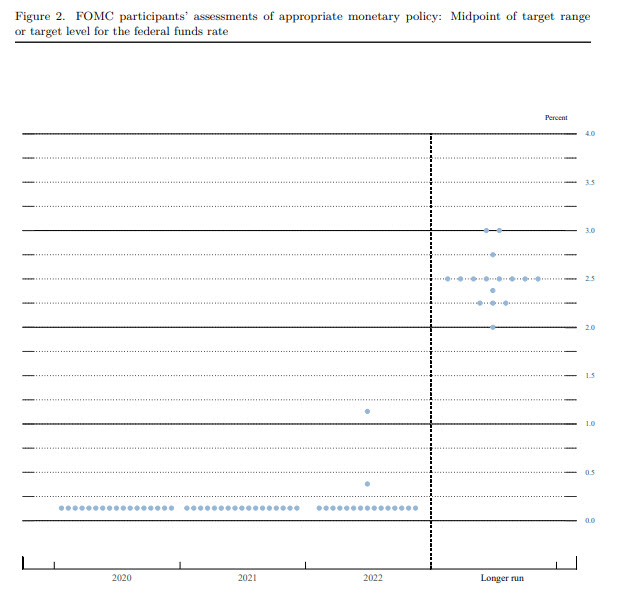
The last time the central tendencies and dot plot was released was way back in December 2019.  At that time, the world was different place.

At the time in December, the Central tendencies saw 2020 numbers at:
  • GDP 2.2%
  • unemployment rate 3.5%
  • PCE inflation 1.9%
The 2021 projections saw:
  • GDP 1.9%
  • unemployment 3.6%
  • PCE inflation 2.0%
The projection for the Fed funds rate at the end of 2020 was 1.6%.  For 2021 the rate rose to at 1.9% with the 2022 rate at 2.1%.
The current median estimate for central tendencies shows 2020 numbers at:
  • GDP -6.5%
  • unemployment 9.3%
  • PCE inflation 0.8%
The projections for the Fed funds rate at the end of 2020 comes in at 0.1%. For 2021 the rate targets 0.1% with the 2022 rate targeted also at 0.1%.
Below is the chart of central tendencies from the Federal Reserve
Central tendencies
Below is the dot plot with all participants keeping the rate at 0.1%.  In 2022, there are two voting members to forecast day higher rate.  The market was looking for the Fed to keep rates low through 2022
Dot plot

OECD estimates a 6% slump in the global economy in latest forecast update

Adding that a 7.6% fall in the global economy is possible if there is a secondary wave of the coronavirus outbreak

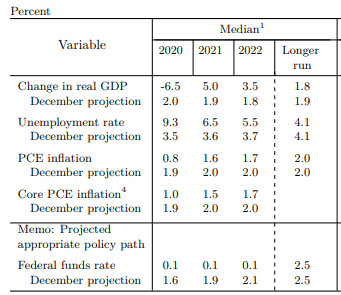
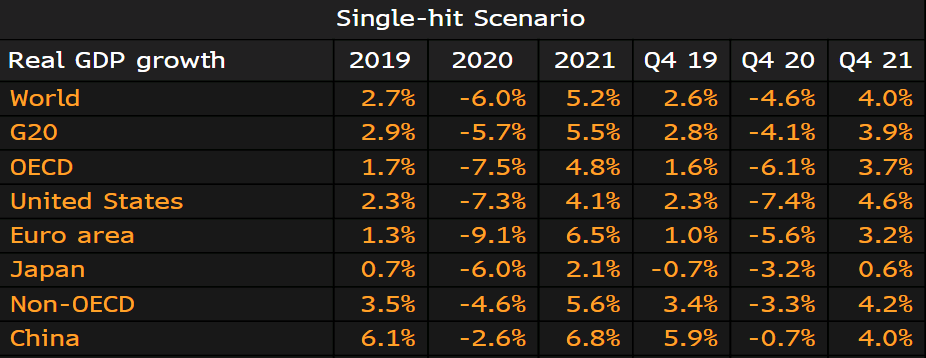
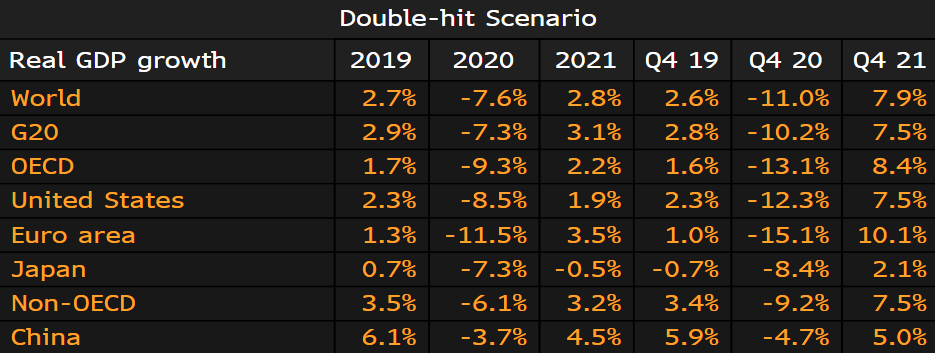
This compares to the early March forecast here, which is long outdated considering the coronavirus developments across the globe since then.
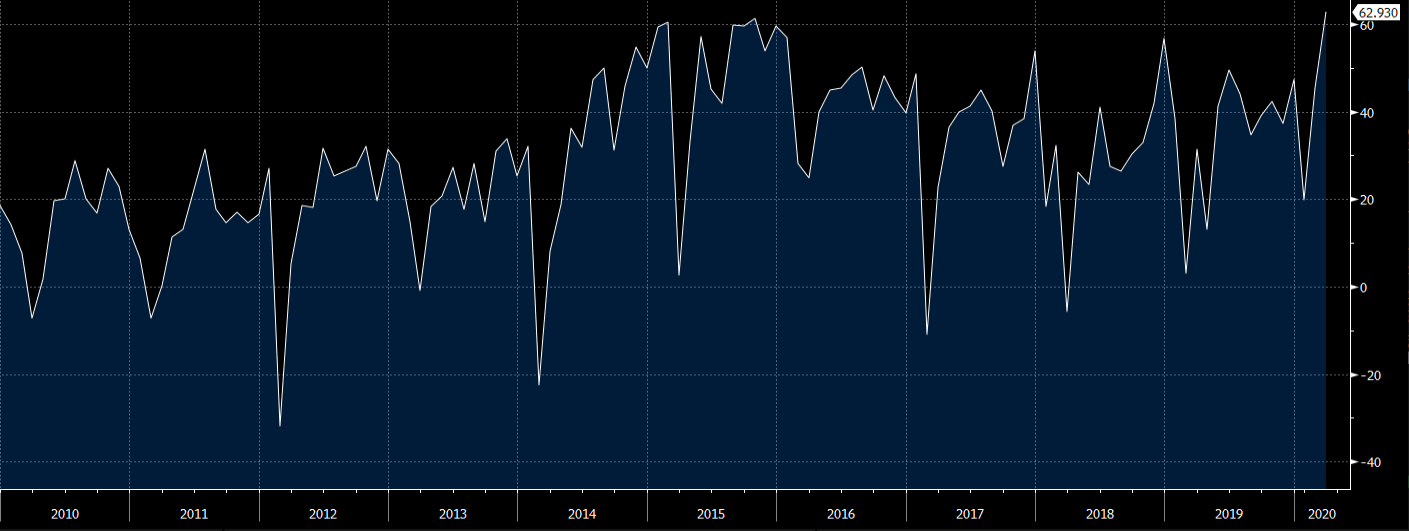
OECD warns that governments cannot prop up businesses and wages indefinitely, and instead must support the reallocation of capital and workers following initial stimulus efforts to counteract the fallout from the coronavirus outbreak.
They also warn that the pandemic has exacerbated inequality across workers and that some working sectors are facing long-term damage with more dire consequences yet to surface from the economic crisis that is taking place at the moment.

NBER says US recession began in February

Business Dating Cycle Committee says contraction ongoing

The US National Bureau of Economic Research says the American economy fell into recession in February to end an expansion that started in June 2009.
It was the longest expansion in US history at 128 months.
In determining the date of the monthly peak, the committee considers a number of indicators of employment and production. The committee normally views the payroll employment measure, which is based on a large survey of employers, as the most reliable comprehensive estimate of employment. This series reached a clear peak in February.
There’s no magic in determining a recession but the NBER generally gets the privilege of making the call in the US.

Japan Q1 final GDP -2.2% vs -2.1% expected

Quarter-over-quarter annualized growth data

  • Most-recent estimate was -3.4%
  • q/q -0.6% vs -0.5% expected
  • Private consumption -0.8% vs -0.7% expected
  • Business spending +1.9% vs +1.5% expected
  • Prelim business spending -0.5%
The big jump in business spending led to the final reading getting a boost to -2.2% from -3.4%. Obviously that’s not going to hold up into Q2, where the consensus is -8.3%. Economists still don’t see any growth until Q2 of 2021.
This number along with the latest current account data (which was a huge miss) have had no impact on JPY.

China trade surplus hits record as medical-exports jump and crude prices plunge

China May trade surplus data

China May trade surplus data
  • Trade surplus $62.93B vs $41.40B expected
  • Prior $45.33
  • Exports +1.4% y/y
  • Imports -3.3% y/y (USD)
This data was out Saturday and it’s way off consensus but it makes a great deal of sense. The first thing is that China imports massive amounts of oil and with crude prices very low in May, that’s a big help. Prices of other imports like soybeans and natural gas were also low. The value of auto imports also shrunk by 31.3% as commerce slowed down.
Secondly, exports of medical devices were up 88.5%. That’s a result of the virus and doesn’t include a 25.5% rise in textiles, which is the category that includes masks.
Finally, the resumption of Chinese activity in April/May after virus closures led to a backlog of orders that needed to be filled.
Go to top