rss

Eurozone October flash manufacturing PMI 54.4 vs 53.0 expected

Latest data released by Markit – 23 October 2020

  • Prior 53.7
  • Services PMI 46.2 v 47.0 expected
  • Prior 48.0
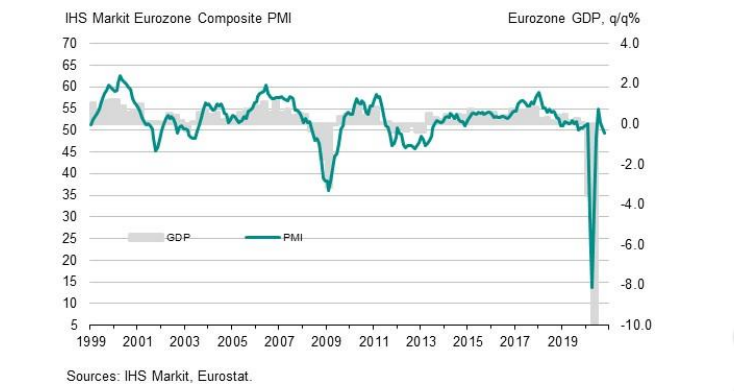
  • Composite PMI 49.4 vs 49.2 expected
  • Prior 50.4
The readings here fit with the narrative with what we have seen from the German and French readings – more so the former – earlier in the past 45 minutes.
It reaffirms a two-paced ‘recovery’, where the manufacturing sector is keeping more resilient overall while the services sector momentum continues to fade into Q4.
Overall business activity eases slightly compared to September, with the composite reading moving back into contraction territory, but the decline in conditions is looking more measured (though it is also skewed by Germany’s resilience) – for now at least.
We will have to see how things go in November for a better sense of that.

“The eurozone is at increased risk of falling into a double-dip downturn as a second wave of virus infections led to a renewed fall in business activity in October.

“The survey revealed a tale of two economies, with manufacturers enjoying the fastest growth since early-2018 as orders surged higher amid rising global demand, but intensifying COVID-19 restrictions took an increasing toll on the services sector, led by weakening demand in the hard-hit hospitality industry.

The divergence is even starker by country. While Germany is buoyed by its manufacturing sector booming to a degree exceeded only twice in almost 25 years of survey history, the rest of the region has sunk into a deepening downturn.

“While the overall downturn remains only modest, and far slighter than seen during the second quarter, the prospect of a slide back into recession will exert greater pressure on the ECB to add more stimulus and for national governments to help cushion the impact of COVID-19 containment measures, which not only tightened across the region in October but look set to be stepped up further in November.”

China Q3 GDP +2.7% q/q (expected +3.3%)

A miss for the data from China, a rare occurrence.

China Q3 GDP

+2.7% q/q

  • expected +3.3% q/q, prior +11.5%

+4.9% y/y

  • expected +5.5% y/y, prior was +3.2%
What will have had a notable negative impact is the recovery in imports into China, but the effect of this is as a depressing impact on GDP. But, strong imports are a sign of economic strength so I suspect there will be a catch up ahead for GDP. Over the weekend PBOC Gov Yi Ganag said he expected positive growth in China for 2020. So far, YTD, economic growth is +0.7 so he looks to be on the oney.

Also out at the same time, ‘activity data for September, which is much better.

Industrial Production 6.9% y/y, helped along by improving exports.

  • expected 5.8%, prior was 5.6%

Industrial Production YTD 1.2% y/y

  • expected 1.0%, prior was 0.4%

Fixed Assets (excluding rural) YTD +0.8% y/y

  • expected 0.9%, prior was -0.3%

Retail Sales +3.3% y/y, indicative of a continued rebound for domestic consumption

  • expected 1.6%, prior was 0.5%

Retail Sales YTD -7.2% y/y

  • expected -7.4%, prior was -8.6%
Market impact so far is a small sell off for risk currencies such as AUD and NZD …. but its small. Stocks in China also off.

FT says 2nd wave means Europe’s economy is sliding towards a double-dip recession … what it means for EUR

Via the Financial Times a key risk for a continued euro rally, a double-dip recession brought on by the 2nd wave of COVID-19 infections gaining pace across the continent.

Germany, France, UK, Italy, Spain, Netherlands have all brought in new restrictions to counter the 2nd wave growth
  • Further restrictions are expected to be announced this week.
“I can’t believe how fast the second wave has hit,” said Katharina Utermöhl, senior economist at Allianz. “We now see growth turning negative in several countries in the fourth quarter — another recession is absolutely possible.”
FT link. (may be gated)
Europe is already looking worse on economic data indications, positioning is also a weight on EUR/USD.

US posts record $3.1 trillion deficit in 2020 fiscal year

Three trillion deficit, largest ever by a margin

US posts record $3.1 trillion deficit in 2020 fiscal year
  • Year-ago deficit $984B
  • September deficit $125B vs 124B exp
  • Sept 2019 $83B
  • Outlays $498B vs $291B in 2019
  • Receipts $373B vs $374B in 2019
The thing is, $3.1 trillion hides just how large it is. Much of the PPP money isn’t accounted for until it’s forgiven and there’s other COVID money out there that’s not accounted for yet either. Then there is the coming stimulus package and whatever else comes.
The prior record was in 2011 at $1.3 trillion.
It’s tough to see deficits falling below $1 trillion any time this decade.

Second round of stimulus will provide limited support to growth, highlights credit-negative fiscal constraints -Moody’s

On 12 October, India (Baa3 negative) unveiled its second round of fiscal stimulus, amounting
to INR467 billion ($6.4 billion), or about 0.2% of our real GDP forecast for fiscal 2020,
ending March 2021. Notwithstanding the fiscal prudence of the measures, the small scale of
the stimulus highlights limited budgetary firepower to support the economy during a very
sharp contraction, a credit negative.
The new stimulus, which includes cash payments to government employees and interestfree loans to states, aims to boost consumer spending during India’s festive season, and to
increase capital expenditure. The measures will involve additional direct official spending of
around INR410 billion, but will not require fresh funding given that the government lifted its
borrowing limit earlier in 2020 to allow for coronavirus-related expenditure.
Even when combined with the government’s fiscal stimulus earlier in 2020, the size of the
measures remains modest. In total, the two rounds of stimulus bring the government’s direct
spending on coronavirus-related fiscal support to around 1.2% of GDP. This compares with an
average of around 2.5% of GDP for Baa-rated peers as of mid-June. (more…)

Go to top