rss

CFTC commitments of traders: EUR long position trimmed but still the largest speculative position.

Weekly forex futures positioning data from the CFTC for the week ending Tuesday, February 2, 2021

  • EUR long 137K vs 163K long last week. Longs trimmed by 26K
  • GBP long 10K vs 8K long last week. Longs increased by 2K
  • JPY long 45K vs 45K long last week. Unchanged
  • CHF long 15K vs 10K long last week. Longs trimmed by 5K
  • AUD short 1K vs 1K long last week. The speculative position went from long 1K last week to short 1K this week
  • NZD long 12K vs 15K long last week. Longs trimmed by 3K
  • CAD long 14K vs 14K long last week. Longs increase by 4K
  • Last week’s report

Below is a chart of the EUR speculative position going back one year.

EUR speculative position

Stocks end a solid week with gains today

NASDAQ index leads the way

The major US stock indices are ending a solid week with gains across the board.  Of the big 3 indices, the NASDAQ led the way. However, the Russell 2000 have the largest gains at 1.27%.
  • The S&P and NASDAQ and Russell 2000 all closed at record levels
  • Dow, S&P on track for 5 day winning streak
  • major indices had their best week since early November
For the day:
  • S&P index rose 15.06 points or 0.39% to 3886.80
  • NASDAQ index rose 78.55 points or 0.57% at 13856.29
  • Dow rose 92.25 points or 0.30% to 31148.11
For the trading week,
  • Dow industrial average rose 3.89%
  • S&P index rose 4.65%
  • Russell 2000 index rose 7.59%

EURUSD extends to new highs

Up for 8 consecutive hourly bars

The EURUSD has extended to new session highs and in the process has moved above the high price from yesterday at 1.20422. The high from Wednesday at 1.2050, and the 50% retracement of the move down from the January 29 high comes in at 1.20534. Those are the next upside targets.
EURUSD on the hourly chart
The pair is now up on 8 consecutive hourly bars (the last bar closed at 1.2037) , and has closed above its 100 hour moving average for the last 4 consecutive bars. The 100 hour moving average currently comes in at 1.20203. Stay above keeps the buyers in control from the short term at least.

Bakers Hughes oil rig count 299 vs 295 last week

The weekly rig count

The Baker Hughes rig count for the current week shows:
  • Oil rigs 299 vs. 295 last week and 298 estimate
  • Gas rigs 92 vs. 88 last week and 88 estimate
  • Total rigs 392 vs. 384 last week and estimate of 386

The WTI crude oil is trading up $0.54 or 0.96% $56.77. It is trading close to the lows for the day at $56.43 although still higher on the day. The high price reached $57.29

European shares end mixed. Italy, Spain leads the way this week

German DAX falls slightly breaking the 4 day win streak. Italy and Spain have risen for 5 consecutive days

The European shares are ending the session with mixed results. Italy and Spain led the way today and in this week. Each of their indices increased every day this week.

A look at the provisional closes shows:
  • German DAX, -0.06%. That’s the 1st decline this week
  • France’s CAC, +0.82%
  • UK’s FTSE 100, -0.12%
  • Spain’s Ibex, +1.0%
  • Italy’s FTSE MIB, +0.7%
For the week provisional closes shows:
  • German DAX, +4.6%
  • France’s CAC, +4.6%
  • UK’s FTSE 100, +1.4%
  • Spain’s Ibex, +5.7%
  • Italy’s FTSE MIB, +7%
In other markets as European traders prepare to exit for the weekend shows:
  • spot gold is rebounding today at up $16.14 or 0.90% to $1810.24. The contract is just off the high price of $1811.38. The low price extended to $1792.19.
  • Spot silver is trading up $0.53 or 2.0% at $26.88. It’s high price reached $26.93. It’s low price extended to $26.20
  • WTI crude oil futures are trading up $0.66 or 1.17% $56.90. The high price has reached $57.29. The low price has extended to $56.43
  • Bitcoin is trading up $220 or 0.58% at $37892
In the forex, the AUD remains the strongest of the major currencies, while the USD has taken over as the weakest of the majors.  At the start of the New York session the US dollar was mixed to modestly lower with gains vs. the JPY and the NZD.  That trend has reversed on the back of the weaker employment report.

Dollar momentum hinges on extended downside break in EUR/USD, what levels to look out for?

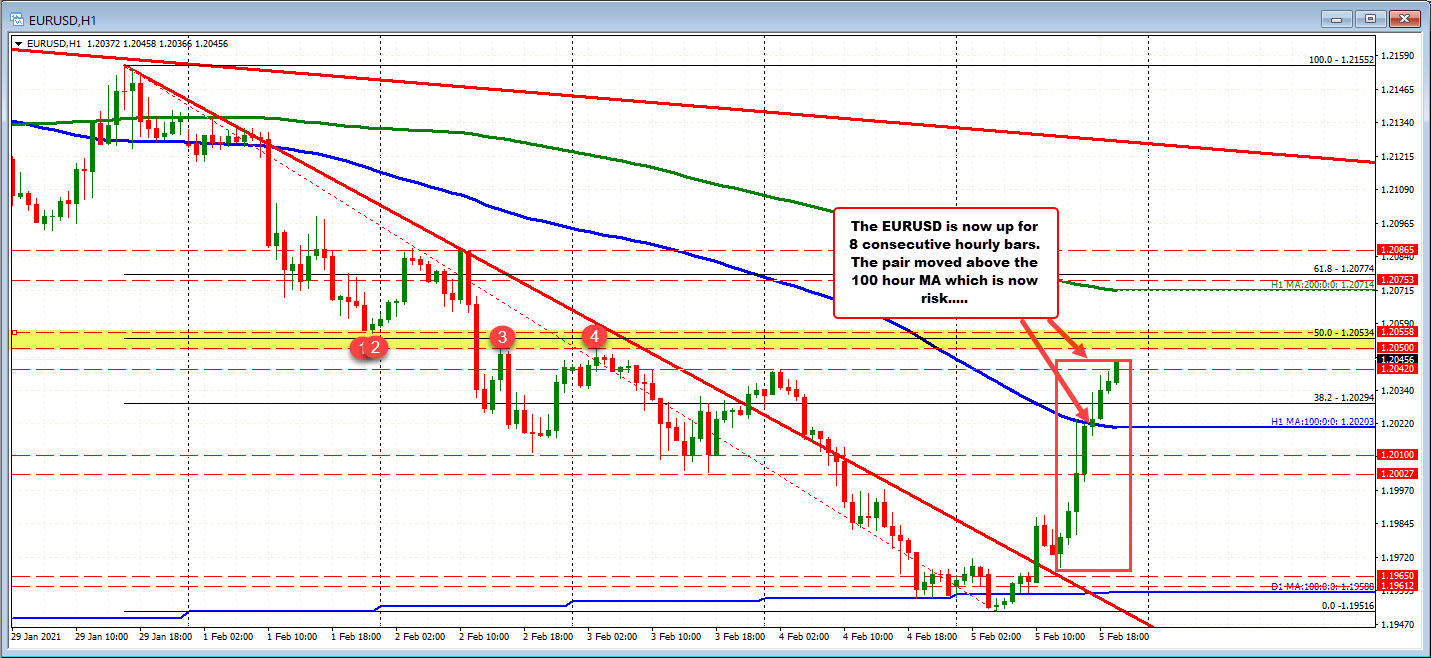
EUR/USD holds below 1.2000 but price action centers around its 100-day moving average ahead of non-farm payrolls

EUR/USD D1 05-02

Sellers have kept with the downside break below support @ 1.2059-64 earlier in the week and even took out the 1.2000 handle in trading yesterday.

However, there is some added support from the 50.0 retracement level of the November swing move higher and the 100-day moving average (red line) @ 1.1967-76 now.
That is the key region to watch ahead of the closing stages of the week as the dollar trades to a two-month high ahead of the non-farm payrolls report later in the day.
As much as one wants to argue for/against dollar strength at this point in time, the charts continue to tell the story in trading this week – as it has for the most part.
In the case of the dollar’s upside run, I would argue that hinges on a break of EUR/USD below the support region currently highlighted above.
As for buyers, holding above that and pushing back above 1.2000 would be the first step in trying to break the dollar’s recent resurgence to start the new year.
That said, a further break to the downside from hereon is likely to only exacerbate dollar gains even more in the coming sessions with little in the way of EUR/USD from pushing back towards the 1.1888-00 region next.
What that means is that should the dollar extend its run higher from hereon, expect gains to be sharper across the board as more and more technical levels give way.
Adding to that will be a potential run in USD/JPY above its own 200-day moving average.

Another moving part to be mindful about is the technical breakdown in EUR/GBP below 0.8800 currently. That opens up a potential move towards the lows from April to May last year at around 0.8671-82 and that could spell further downside for EUR/USD.
Go to top