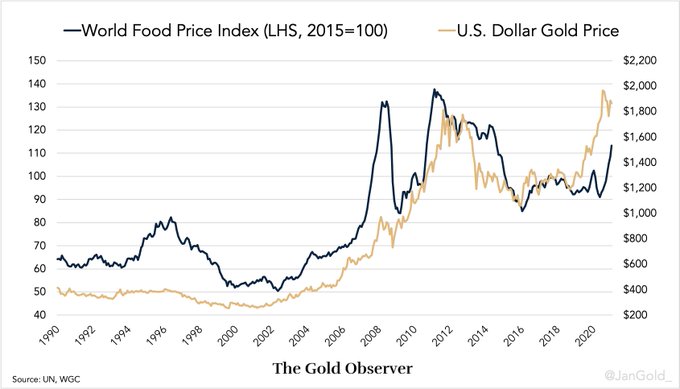
In January 2021 the World Food Price Index was up 4.3% from December 2020, and up 10.6% from January 2020


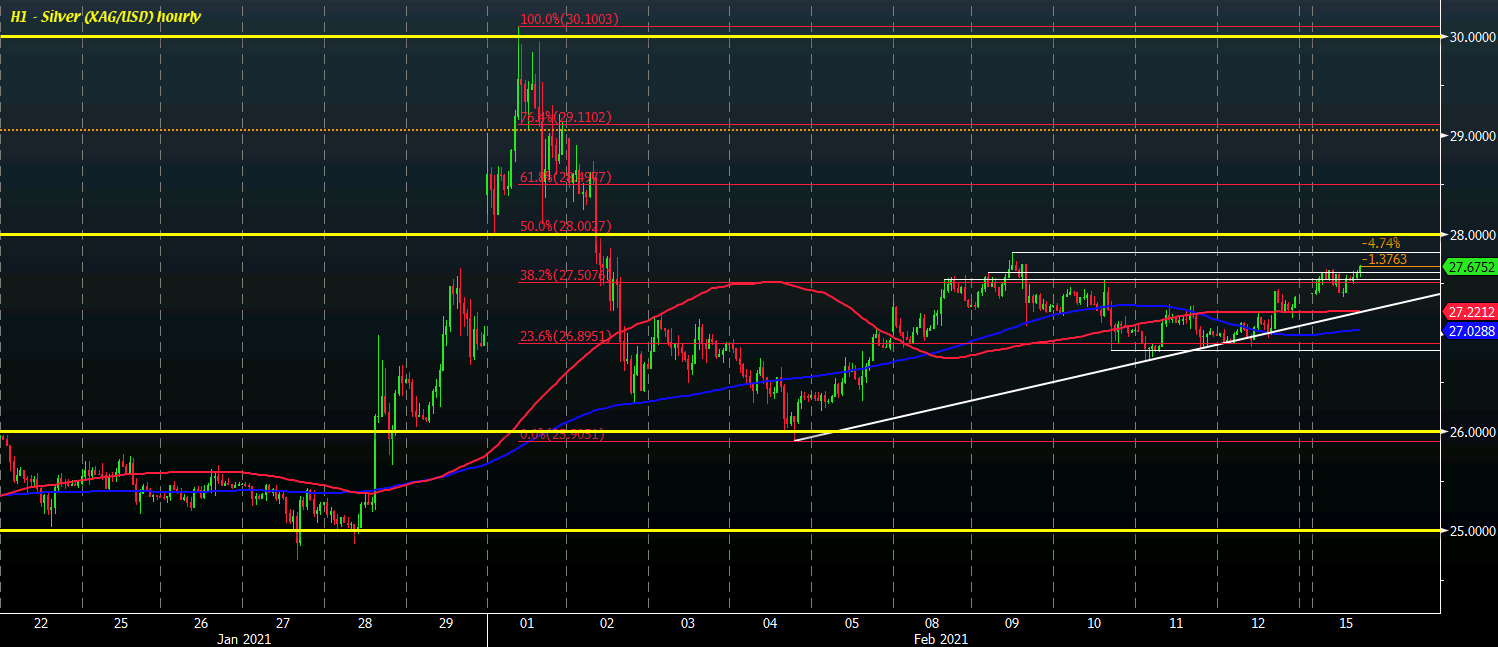
Drilling into price action, buyers are in near-term control as long as price holds above the key hourly moving averages @ $27.03-22. Further support is then seen closer to $26.70-82 from the lows last week.
Meanwhile, last week’s highs near $27.80 and the $28.00 level (50.0 retracement level) are key resistance points to focus on if the upside move extends this week.


USOIL dropped over 1% to 3-day lows at $57.50 after it printed 13-month highs of $58.98 on Wednesday. Brent crude, meanwhile, holds over the $60 mark, a level that has been seen since February of 2020. Oil price softness is reflected in the overall risk cautious market sentiment, leaving global equity markets settling off record highs.
However the Oil market has been overall underpinned by a variety of factors, including demand-stimulating cold weather, continuing OPEC+ supply constraints (Saudi Arabia last week commenced a unilateral supply cut that will last through to the end of March) the large inventory draw in weekly US data last week, dropping positive Covid tests worldwide and vaccine optimism, and the approaching mega-stimulus spending program in the US economy. OPEC’s resolve in capping production, along with fiscal stimulus, and hopes for a faster economic recovery now that vaccines are on the rise, have combined to support oil prices since November.
Additionally, the IEA February oil market report released yesterday further strengthened the positive outlook for Oil as it said that: “World oil demand is set to grow by 5.4 mb/d in 2021 to reach 96.4 mb/d, recovering around 60% of the volume lost to the pandemic in 2020. While oil demand is expected to fall by 1 mb/d in 1Q21 from already low 4Q20 levels, a more favourable economic outlook underpins stronger demand in the second half of the year”. The IEA said global supply rose 590k bpd in January, even as OPEC+ cut output, with the balance being made up from non-OPEC+ producers, namely the US and Canada. Hence overall, the agency looks for demand to overtake supply in H2 of this year, and for inventory drawdowns to continue, which is likely to keep crude prices supported.
On the flipside there are also some downside risks to the oil market ahead, however, given the contradistinction of prices having returned to pre-pandemic levels even as the actual demand globally has not returned to pre-pandemic levels and it is unlikely to for a considerable time yet. In the basket of worries there are also geopolitics as President Biden looks to continue what Trump started. More precisely, some tough talk aimed at China from US President Biden was blamed by some on the souring in sentiment. US President Biden spoke of concern about China’s “coercive and unfair economic practices” as well as human rights. Hence markets will be watching for signs of how the relationship between the two countries will change under Biden.
In the bigger picture, the reflation trade seems more likely to revive and sustain than not, given the precipitous decline in the rate of new positive Covid test outcomes worldwide (including South Africa, despite the supposed hyper-transmissibility of the dominant SARS-Cov2 variant there), vaccine rollout, stimulus, and prospects for a lockdown-saving fuelled consumer spending spree in developed economies as and when societal restrictions are lifted. This translates as a weaker USD call, but a well supported Oil.
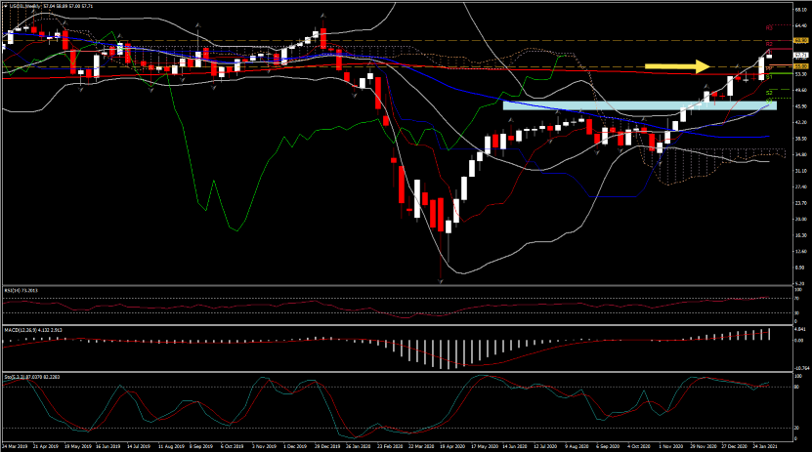 USOIL has been holding in a bullish sloping channel over the last 4 months, developing beneath the simple moving averages (200-week DMA since February 2) and the Ichimoku cloud in the weekly timeframe since November.
From a technical perspective, the RSI is pointing up in the positive territory, crossing above 70, indicating further upside move in the medium term, as the MACD lines extend northwards as well, supporting the positive overall outlook. However, in the near term, the small pullback this week along with the bearish crossover on the daily stochastic oscillator within the %K and %D lines in the overbought zone, suggest that a correction could be seen the next few days as happened in the last 2 weeks of January when the asset in the near term was overbought, as 6 consecutive daily candles have remained outside the upper Bollinger band area since last week. Hence a correction or consolidation might follow.
Meanwhile, key Resistance is at 60.90 (weekly R2 and July 2019 weekly tweezer top), and immediate resistance stands at 60. Hence if the price fails to jump above these levels, this could pull the price back towards the 55.00 Support area which is set at the 20-day SMA and close to weekly PP and January’s up fractal which is now converted into a key Support. Steeper decreases could open the door for the 45-47 zone (20-week SMA and Q2-Q3 2020 Resistance area), increasing the selling interest. Alternatively, a successful attempt above 60.90 could drive the market to the 2019 highs within the 64-66 zone.
In conclusion, the black gold is creating higher highs and higher lows in the long-term timeframe and only a fall below 47.00 may change this positive outlook.
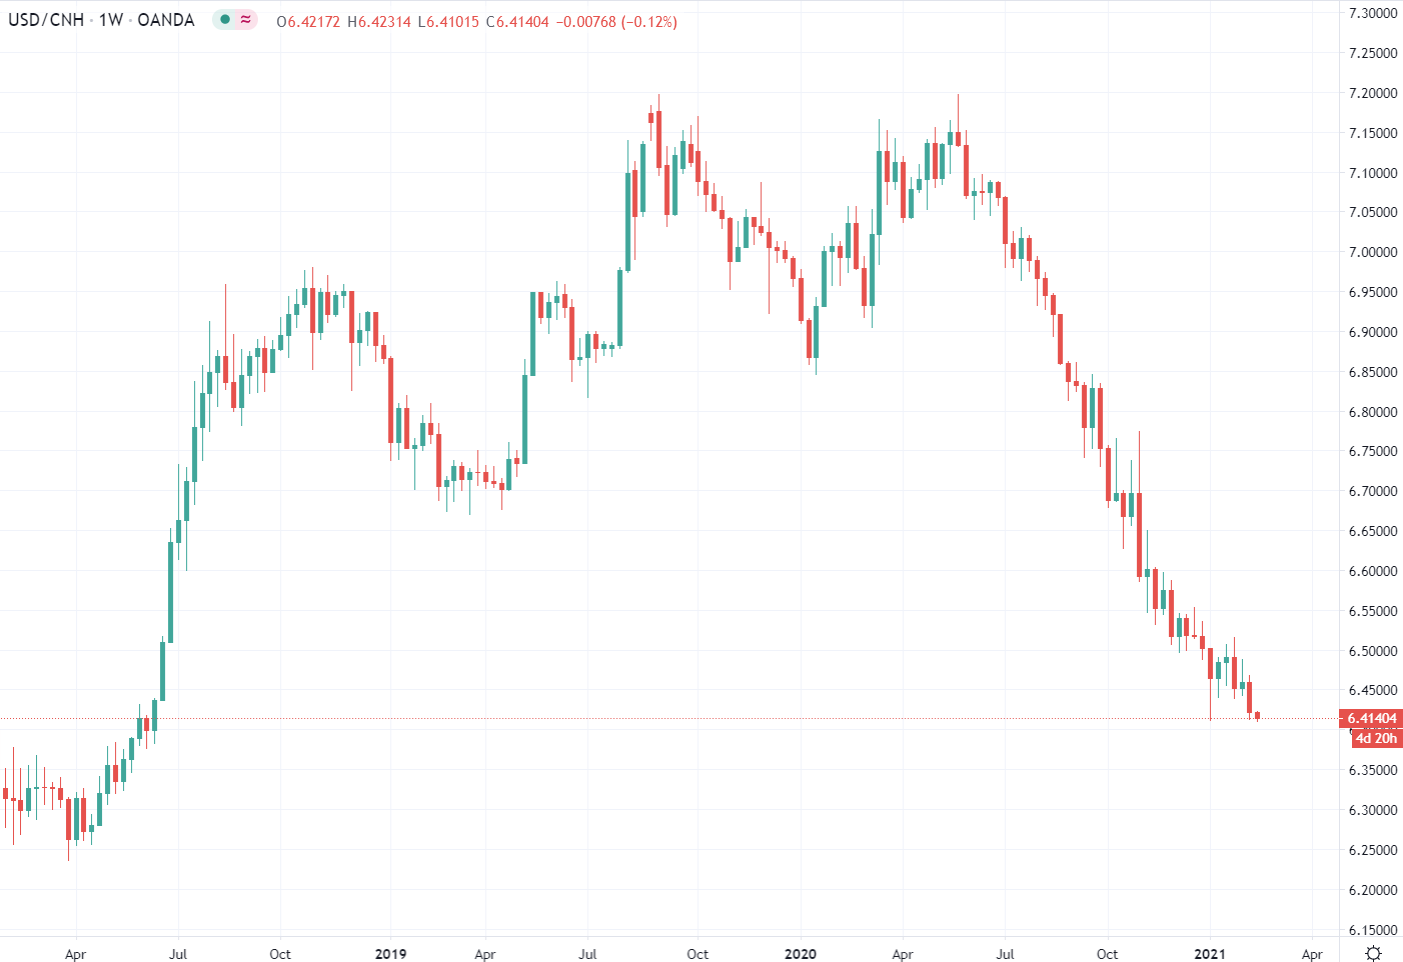
China is on holidays for most of this week (LUnar New Year) and there is little fresh news crossing from the coutnry.
Singapore’s Ministry of Trade and Industry (MTI) maintains 2021 GDP growth forecast at +4% to +6%
Following the data release are comments from Singapore’s trade secretary:
GDP sa 3.0% q/q
GDP annualised sa 12.7% q/q
GDP nominal 2.5% q/q
GDP deflator (an inflation indication) 0.2%
Private consumption 2.2% q/q
Business spending 4.5% q/q