rss

Goldman Sachs update their gold price forecasts, 3, 6 and 12 months (and on what could take it to $1600)

Gold price projections from Goldman Sachs:

  • 3 months $1450 (prior forecast was at $1350)
  • 6 months $1475 (from $1350)
  • 12 months $1475 (from $1425)

Reasoning from GS:

  • gold supported by central bank buying, GS expect the buying to be more than 100 tonnes over last year’s levels
  • lower real interest rates to support gold

More:

  • base case scenario is global growth gradually improves in H2 of 2019
  • recession worries recede
  • should eventually lead to a gradual moderation in “fear” driven investment demand for gold
  • Emerging market GDP growth gradually improves

GS say they see less tactical upside for gold

  • but weak growth in DM is a positive strategically (portfolio diversification)
  • if slow growth in DM persists, GS expect 2016 to repeat (ETF buying increased by 800 tonnes Jan to Sep that year) – this could take gold prices above $1600

Reuters report that China is to halt all meat imports from Canada

Reuters on a media report (Le Journal de Montreal citing an official in the office of the Chinese consul general in Montreal)

China will turn away any “meat products” shipped from Canada starting on Wednesday
  • China said it found a number of fake veterinary health certificates for meat products imported from Canada because of poor supervision
A negative input for CAD
The background to this is increasingly tense relations between China and Canada ever since the arrest of the Huawei official (and only daughter of the firm’s founder), Chief Financial Officer Meng Wanzhou.
Reuters on a media report (Le Journal de Montreal citing an official in the office of the Chinese consul general in Montreal)

The Nasdaq index leads a down day in the US stock market

Nasdaq is down -1.51%

The Nasdaq index has led a down day in the US stock market.    The price of that index fell back below its 50 hour MA (a bearish tilt to the downside) and stayed below.  The catalyst was less dovish comments from the most dovish Fed official, James Bullard (or the one who voted to cut rates at the last meeting).  He said that 50 bps at the next meeting would be stretch.
The 100 hour MA was approached at 7864, but it was a stretch for today to get all the way there today.
The final numbers are showing:
  • S&P index fell 027.97 points or -0.95% at 2917.38. The low reached 2916.01. The high extended to 2946.52
  • Nasdaq fell -120.97 points or -1.51% at 7884.71. The low reached 7879.15. The high extended up to 8007.31 before moving lower
  • The Dow fell -179.32 points or -0.67% at 26548.22. The low reached 26517.66. The low extended to 26752.31.

Fed’s Powell: Many on FOMC see stronger case for more accommodation

Powell speaks at the Council on Foreign Relations:

  • Many on FOMC see stronger case for more accommodation but also do not want to overreact to individual data points or short-term sentiment swings
  • Solid fundamentals are supporting continued growth, strong job creation
  • Unemployment is low, the economy is growing and inflation is near the Fed’s objective
  • Although inflation is running somewhat below target, ‘we have expected it to pick up’
  • Businesses and agricultural contacts have reported heightened concerns over trade developments
  • FOMC’s baseline outlooks remain favorable against backdrop of heightened uncertainties
  • Repeats that the Fed to closely monitor information and act as appropriately
My read is that these comments also aren’t as dovish as expected. There’s nothing here to lead me to believe a 50 bps cut is on the table in any meaningful way. Yes, we still have 5 weeks to go but it doesn’t look like Powell is hitting the panic button.
There will be a Q&A after the speech with the moderator and audience.

Bitcoin got close to 50% midpoint today

50% of the move down from the December 2017 high

The price of Bitcoin on Coinbase is up about $532 at $11385. The high today reached $11470.20. That got the price within $40 of the 50% midpoint of the move down from the December 2017 high at !9891.99, and the December 2019 low at $3128.89.
50% of the move down from the December 2017 high

Another target comes from the daily chart. The 50% of the big move down from the December 2017 high comes in at $11510.44. Like the 50% on the hourly chart, it too will be key for the longer term picture of bulls and bears.  It is a big line in the sand that buyers will need to break to keep the run higher.  Be aware.

Being a key level, it works as a barometer for buyers and sellers.
For buyers, they want to see the level broken, and the trend higher continuing.
For sellers (may be new longs or profit takers), They want to see the price stall against the level and rotate back down.  If it breaks above, those sellers can cover (and even go long).
So the level remains key. Today the digital currency had it’s closest test but it was still $40 short of the target.
Drilling to the hourly chart below, a lower trend line comes in at $11,110.50 currently.  A move belowt that level might see some selling with the lagging 100 hour MA (blue line) at $10762.02 (and moving higher) as another key level on the downside for sellers/bears. Stay above, and the sellers may win a battle but they are not winning the war.
Bitcoin on the hourly chart remains above the 200 hour MA

European shares end mostly lower

Italy down -0.73%. German Dax down 0.3%. UK FTSE up 0.1%

The major European indices are ending mostly lower. The UK FTSE is bucking the trend with a modest gain.
The provisional closes are showing:
  • German DAX, -0.3%
  • France’s CAC, unchanged
  • UK’s FTSE, +0.1%
  • Spain’s Ibex, -1.1%
  • Italy’s FTSE MIB, -0.73%
In the benchmark 10 year notes, yields are mostly lower. The exception is the Italian BTP which is higher by 0.4 bps (it was higher earlier).  The highs and lows, current and changes are outlined in the table below.  NOTE that France’s 10 year dipped below the 0.0% level (currently at -0.006%.
Italy down -0.73%. German Dax down 0.3%. UK FTSE up 0.1%
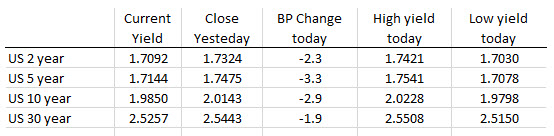
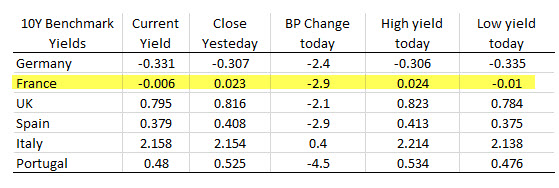
In other markets as London/European traders look to exit are showing:
  • spot gold, plus $8.20 or 0.58% at $1427.83
  • WTI crude oil futures are up $.23 or 0.40% at $58.13
  • Bticoin on Coinbase is up $508 and $11,361
  • S&P indexes down 10.34 points or my 0.35% at 2935.05
  • NASDAQ index is down 53 points or 0.67% at 7952.30
  • Dow is down 44 pointers -0.17% at 26683
US yields are moving lower with the 5-year down -3.3 basis points.
US yields are lower on the day

In the Forex market the NZD remains the strongest of the major currencies, the GBP remains the weakest. The USD is lower as well with small gains vs the GBP, EUR and CHF.

Go to top