rss

European indices end the day in the red

Indices close near lows for the day

The European indices are ending the day lower and also closing near the lows for the day.
The provisional closes are showing:
  • German DAX, -0.5%
  • France’s CAC, -1.4%
  • UK’s FTSE 100, -1.1%
  • Spain’s Ibex, -1.7%
  • Italy’s FTSE MIB, -0.7%
For the week, the indices are down sharply:
  • German DAX -4.0%
  • France’s CAC -3.49%
  • UK’s FTSE 100, -3.25%
  • Spain’s Ibex, -5.7%
  • Italy’s FTSE MIB, -4.9%
For the month, the German DAX closed near unchanged. The other indices were lower:
  • German DAX, unchanged
  • France’s CAC, -3.1%
  • UK’s FTSE 100, -4%
  • Spain’s Ibex, -4.9%
  • Italy’s FTSE MIB, -1.46%

In the benchmark 10 year yields today, yields have moved back higher after being negative at the start of the North American session

Indices close near lows for the day

European shares end the session mixed

France and Spain indices move lower

The European shares are ending the session with mixed results. France and Spain indices are lower. Germany, UK, Italy are trading higher.

The provisional closes are showing:
  • Germany Dax, +0.44%
  • France CAC, -0.36%
  • UK FTSE 100, +0.6%
  • Spain’s Ibex, -0.34%
  • Italy’s FTSE MIB, +0.2%
For the week, the indices closed higher:
  • German DAX, +2.3%
  • France’s CAC, +1.9%
  • UK’s FTSE 100, +3.15%
  • Spain’s Ibex, +1.8%
  • Italy’s FTSE MIB, +3.1%
In the European debt market, the benchmark 10 year yields are mostly and modestly higher. The exception is the Italian 10 year which is trading down -1.5 basis points.
European debt market
In other markets as European/London traders look toward the exits for the week:
  • spot gold is trading at $13.50 or 0.75% $1810.70. The high price extended to $1811.11 the low has reached $1795.96
  • WTI crude oil futures are trading down $0.27 or -0.66% of $40.48. The high for the August contract reached $40.90 while the low extended to $40.02. The September contract is currently trading down $0.27 or 0.66% at $40.66
In  the US equity market, the major indices are trading mixed. The Dow industrial average is down on the day while the S&P and NASDAQ index are currently trading in the black
  • S&P index is up 3.25 points or 0.10% at 3218.81
  • NASDAQ index is up 11.5 points or 0.11% at 10,485.25
  • Dow industrial average is trading down 43.12 points or -0.16% at 26691.40
In the US debt market the yields are trading near unchanged across the curve:
  • 2 year 0.143, -0.2 basis points
  • 5 year 0.278%, +0.3 basis points
  • 10 year 0.618%, +0.1 basis point
  • 30 year 1.314%, +0.6 basis points
A look at the strongest and weakest currencies at the close of the London session shows the CHF is the strongest and the GBP is the weakest.  The US dollar is mostly lower.

European shares end the session with mixed results

Italy and Portugal indices move higher

the major European indices are ending the session with mixed results. Germany, France, UK and Spain show declines while Italy and Portugal eked out gains. The closes are showing:

  • German DAX, -0.43%
  • France’s CAC, -0.42%
  • UK’s FTSE 100, -0.62%
  • Spain’s Ibex, -0.2%
  • Italy’s FTSE MIB, +0.3%
  • Portugal’s PSI 20, +0.95%
Italy and Portugal indices move higher_
In the European debt market, benchmark 10 year yields fell across the board with UK yields down the most at -2.8 basis points.
European 10 year yields
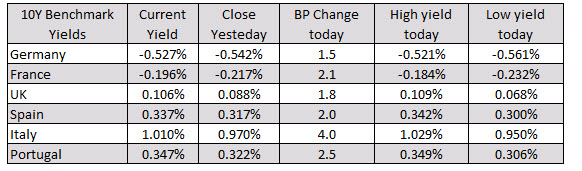
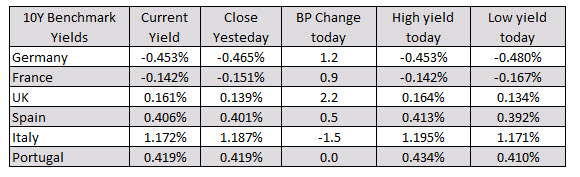
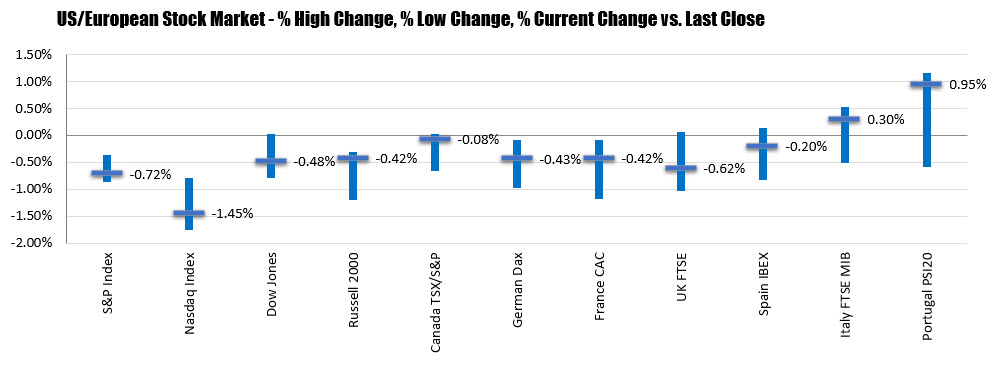
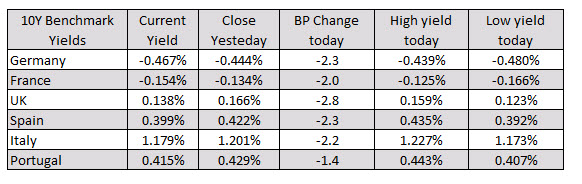
In other markets as London/European traders look to exit:
  • spot gold $-4.25 or -0.23% $1806.05. The high for the day reached $1813.48. The low extended to $1802.97
  • WTI crude oil futures fell $0.19 or -0.46% to $41.01. It’s high price reached $41.18 while the low extended to $40.60. The September contract is currently down $0.21 or -0.51% of $41.19
In the forex market,
  • GBPUSD. The GBPUSD is trading at new session highs in the currently hourly bar. In the process, the price has moved back above its 200 and 100 hour moving average. That tilted the bias back to the upside in what has been an up and down market over the last 7 or so trading days. On the topside a trendline connecting highs from this we currently comes in at 1.2634. The high from yesterday reached 1.26487. The high for the week on Monday reached 1.26652.
  • EURUSD: The EURUSD moved higher in the London session after finding support buyers near the 38.2% retracement of the move up from the Friday low at 1.13759. The high price reached 1.1441. The high price from yesterday reached 1.14512. There is close support at 1.14223 area

UK virus researchers estimate 250,000 people in Wuhan will have coronavirus in 13 days

It will spread to nearby cities and countries next

It will spread to nearby cities and countries next
A UK expert on the transmission and evolutionary dynamics of infectious diseases has published a paper with four colleagues that estimates transmission parameters for the Wuhan coronavirus and it’s terrifying.
Dr Jonathan Read estimates that only 5.1% of infections in Wuhan are identified and that an explosion in the number of cases is less than two weeks away.
By February 4, he writes that “our model predicts the number of infected people in Wuhan to be greater than 250,000 (prediction interval, 164,602 to 351,396).”
Based on travel patterns, his team predicts the cities with the largest outbreaks elsewhere in China to be Shanghai, Beijing, Guangzhou, Chongqing and Chengdu. The countries with the greatest risk of importing it are Thailand, Japan, Taiwan, Hong Kong, and South Korea.

(more…)

Wall Street ends higher as tech and oil stocks rally

Technology stocks led the advance for the broader US market as investors kept an eye on the strained geopolitics of the Gulf.

The S&P 500 finished 0.3 per cent higher on Monday, with an afternoon rally at one point putting up as much as 0.5 per cent. That also saw the Dow Jones Industrial Average turn positive and close fractionally higher, but it was tech names that led the way, with the Nasdaq Composite rising 0.7 per cent.

Brent crude, the international oil marker, was up 1.5 per cent to $63.43 a barrel, although that left it off earlier highs that took it up as much as 2 per cent after Iran seized a British-flagged tanker in the Gulf on Friday. Furthermore, Libyan output was interrupted after an unidentified group sabotaged production at the country’s largest field, according to its state oil company.

The S&P 500 energy sector was up 0.5 per cent, lagging only tech, as major producers including ExxonMobil, Chevron and ConocoPhillips turned positive during the afternoon session. Halliburton topped the leaderboard with a 9.2 per cent advance following an earnings beat.

European energy stocks fared better earlier on Monday, with a gain of 0.5 per cent for the Stoxx index tracking the sector standing out against a 0.1 per cent rise for the Europe-wide Stoxx 600. London’s FTSE 100 rose 0.1 per cent and Frankfurt’s Xetra Dax 30 was up 0.2 per cent. BP was among the top performers on the main UK index, with the oil major’s shares rising 1 per cent.

Bets that the Fed will aggressively cut rates at its policy meeting this month were being pared back. Bloomberg data showed that under 20 per cent of economists polled were forecasting a 50 basis point cut, down from about 40 per cent late last week. That followed confusion on Friday after the New York Fed clarified that an ultra-dovish speech from John Williams, its president, should not be seen as a guide to future policy.

Investor caution towards geopolitical issues in the Gulf, as well as debate over the prospect for monetary easing from the Federal Reserve, on Friday pushed gold to a six-year high. On Monday afternoon the metal was flat at $1,424.49 an ounce.

Market Poem

u know the old School chartists
are looking at the daily,
and can’t help but notice
what they believe to be
an inverted complex head and shoulders (bottom/continuation) pattern
replete with upward sloping neckline and a higher right shoulder
and the attendant bullish implications
they have come to expect,
or
perhaps they visualize a diamond pattern (debatable implications, there)

ironically,
if the market does indeed trade higher
and makes new historical highs,
or fails to do so,

it will have nothing to do
with the perceived formations

An economist’s XMAS

If you put two economists in a room, you get two opinions, unless one of them is Lord Keynes, in which case you get three.’ As Winston Churchill noted, economists rarely agree on anything. And the topic of Christmas should be no different. Here is our guide to the macroeconomics of Christmas:


Keynesians – place a lot of emphasis on the ‘macro stabilization’ properties of Christmas. Ideally, they would vary the number of Christmases each year according to the state of the economy. This is best summarized by Paul Krugman’s depression paper ‘Wish it could be Christmas every day’, in which he also acknowledges his love of British glam rock. The Keynesians would like to see a larger role for the state, including publically-funded Santas.

Austrians – Believe Christmas is dangerous because it inevitably ends with a nasty January hangover. Also worry about the moral hazard implications of gift-giving and the propensity for overinvestment in Christmas decorations. Reject the idea of ‘public’ holidays, arguing the free market would lead to a better outcome.
Monetarists – Convinced they are the only ones who know how Christmas ‘really works’ and quickly become frustrated with other economists’ lack of understanding. Their thinking can be reduced to a simple identity, though this is vulnerable to shifts in the velocity of Santa’s circulation. Hardcore monetarists believe in the tight control of chocolate coins to prevent the hyper-inflation of waist lines and the hyper-activity of small children. (more…)

Go to top