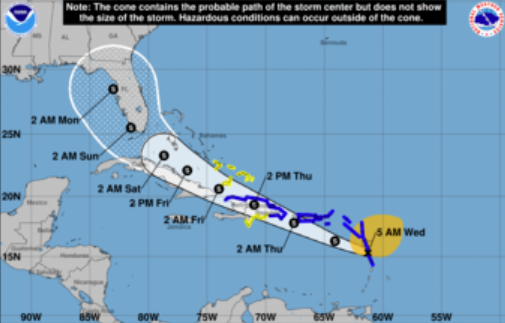
The latest from the NHC forecast
The US National Hurricane Center is out with its latest update on Hurricane Laura and it’s not good.
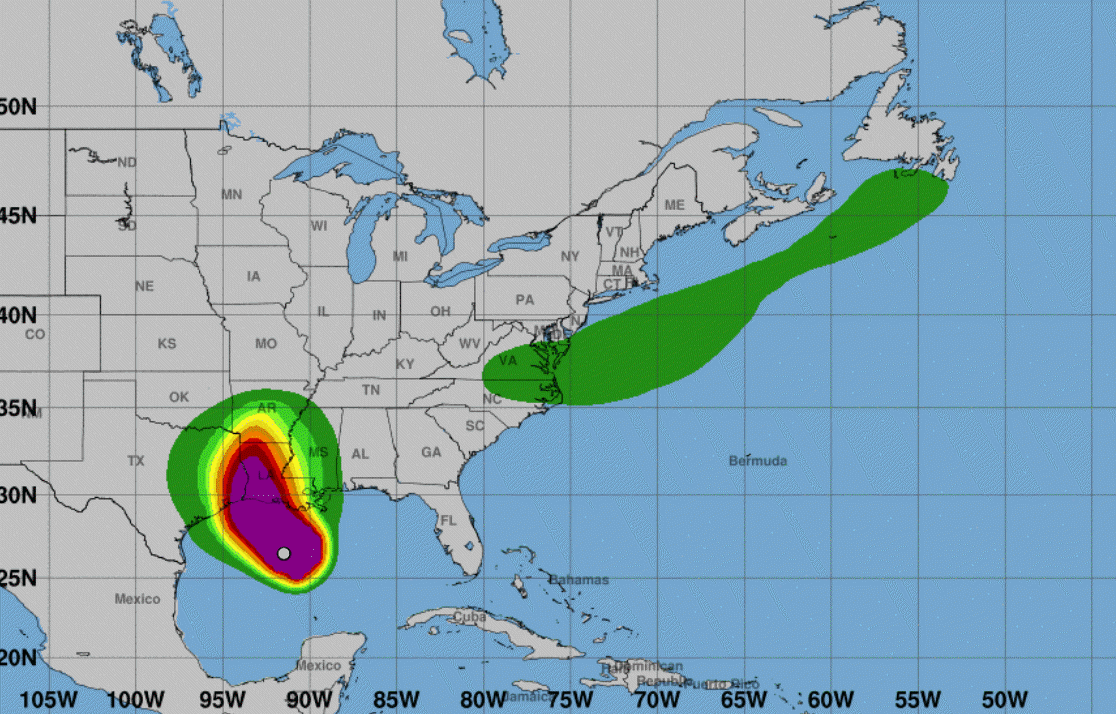
Laura is likely to continue strengthening today while it moves over warm waters of the northwestern Gulf of Mexico and the vertical wind shear remains low. Laura’s intensity could level-off by this evening due to the possibility of an eyewall replacement cycle and the expected increase in shear around the time of landfall. Even if the rate of strengthening eases, Laura is expected to be an extremely powerful category 4 hurricane when it reaches the northwestern Gulf coast.
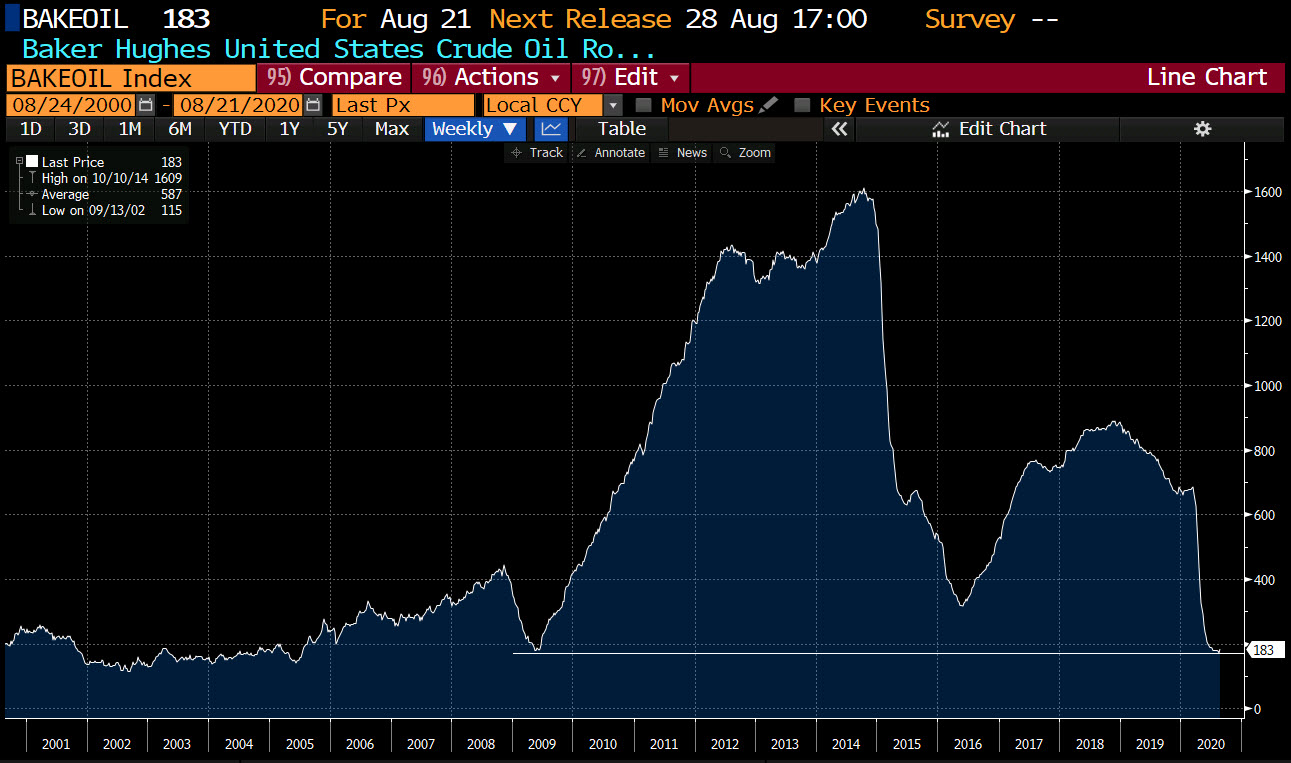
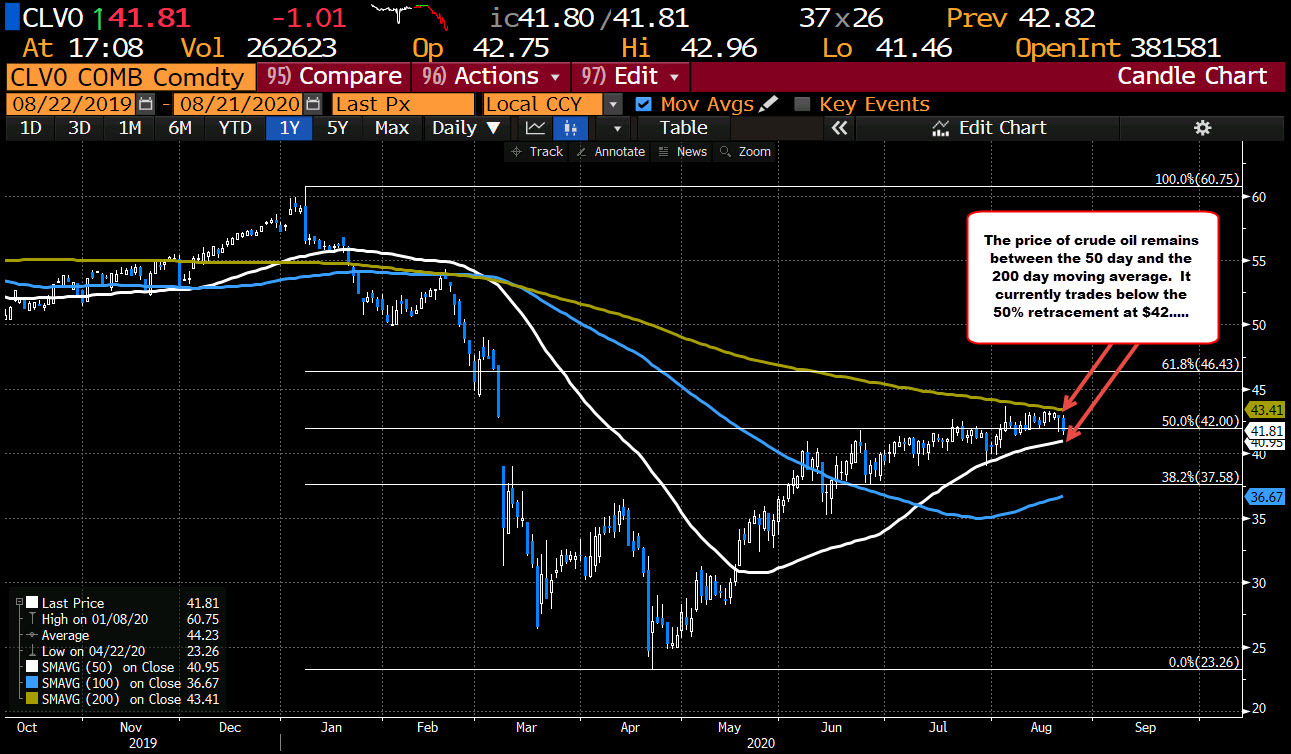
This has the potential to be especially devastating for the oil & gas industry and its workers. The current track takes the eye through or near Beaumont, TX or Lake Charles, LA. Both are massive US refining hubs. The Houston area will also be hit but it now looks like the worst of the storm will pass to the east of it.
Category 4 hurricanes have sustained winds in the 209-251 km/h range, or 130-156 mph. Storm surges are generally 13-18 feet but can be as much as 24 feet. The NHC says the storm surge from Laura could penetrate 30 miles inland.
A recent Category 4 storm was Hurricane Harvey in 2017. It inflicted an estimated $125B in damage as it first made landfall near Corpus Christi and then raked the coast, causing widespread flooding in Houston. It matched Katrina as the most-costly US hurricane.
This storm appears to be faster moving so flood damage may not be as high but wind damage could be worse. It will also then cut across the mid-Atlantic states and could reform as a tropical storm off the coast of North Carolina or Virginia.