Total rig counts up to 254 from 244 last week
In a surprise, the Baker Hughes rig counts moved higher this week.
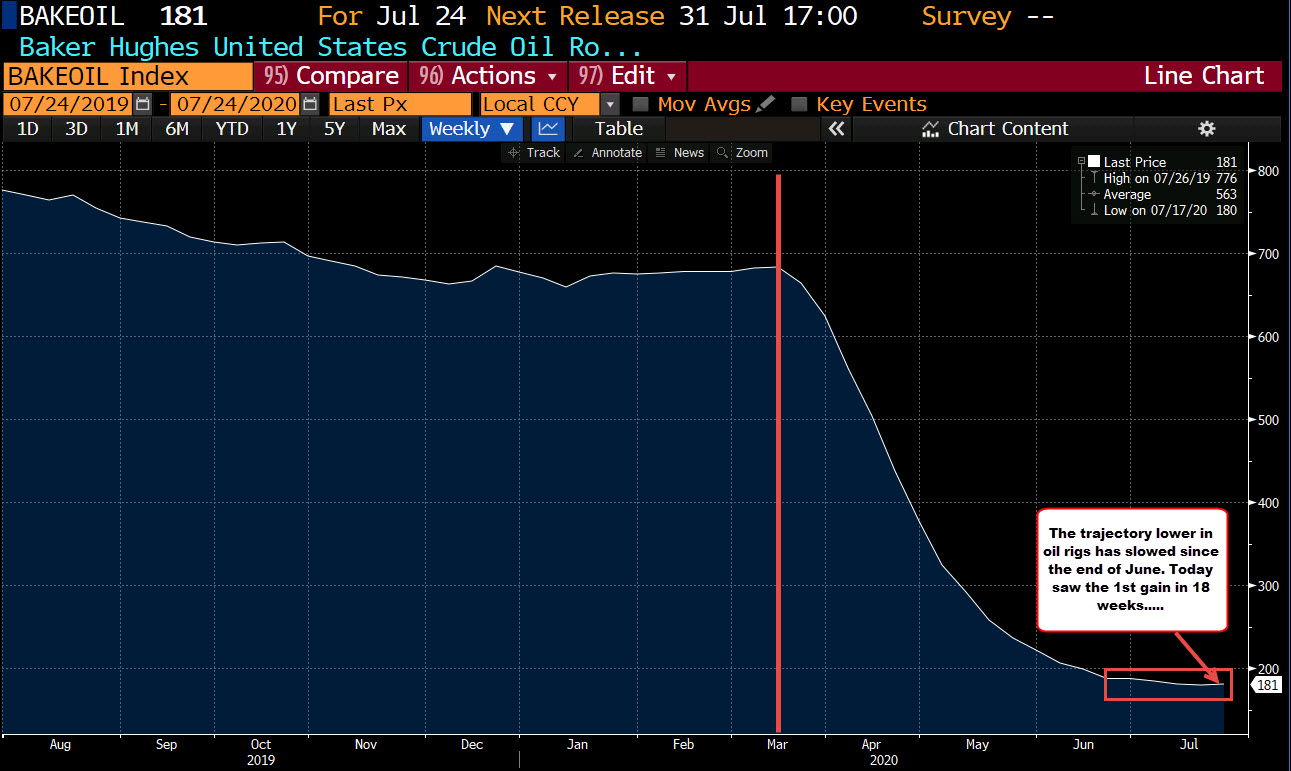
- Total rigs moved to 254 from 244 last week. This is the 1st increase in 24 weeks.
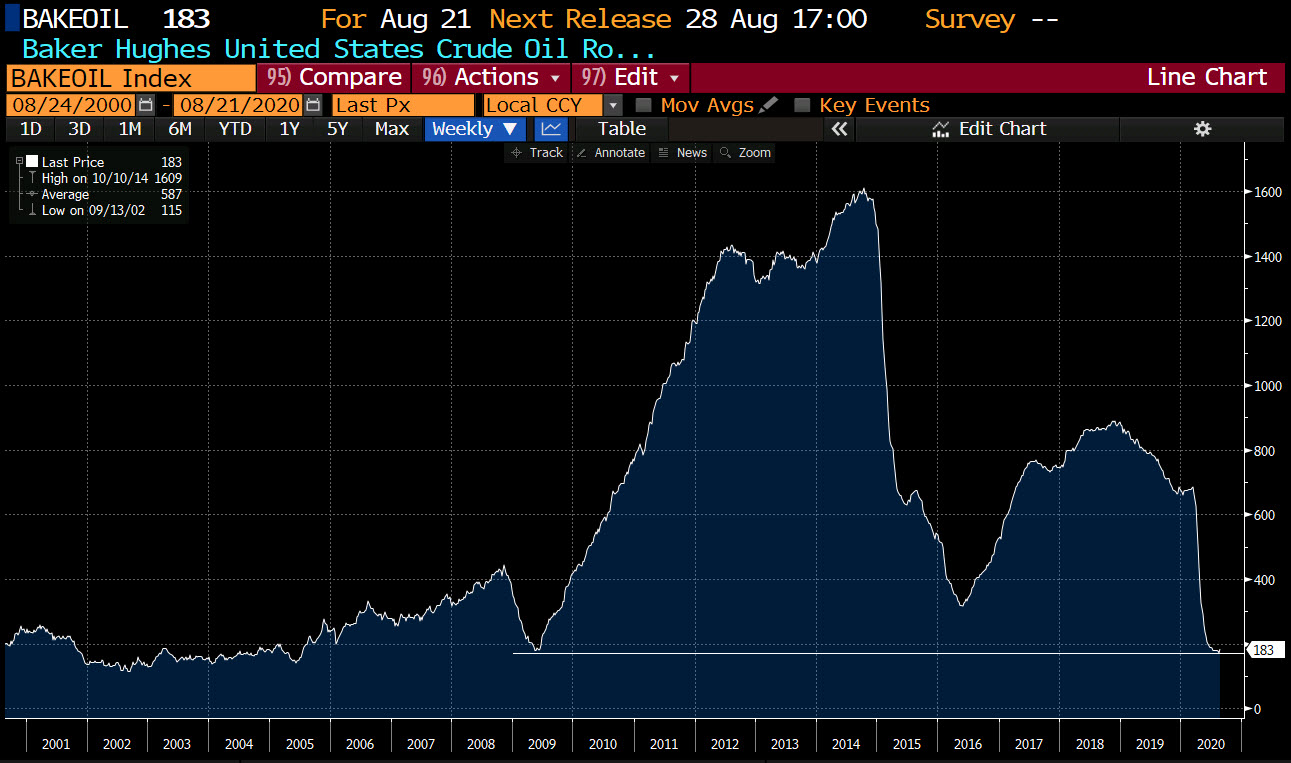
- Oil rigs rose by 11 to 183 from 172 last week. This is the largest weekly gain since January
- Gas rigs fell by 1 on the week to 69 from 70 last week
The oil rigs reached the lowest level since 2005 last week. The move up to 183 is the highest since July 3 when rigs came in at 185.

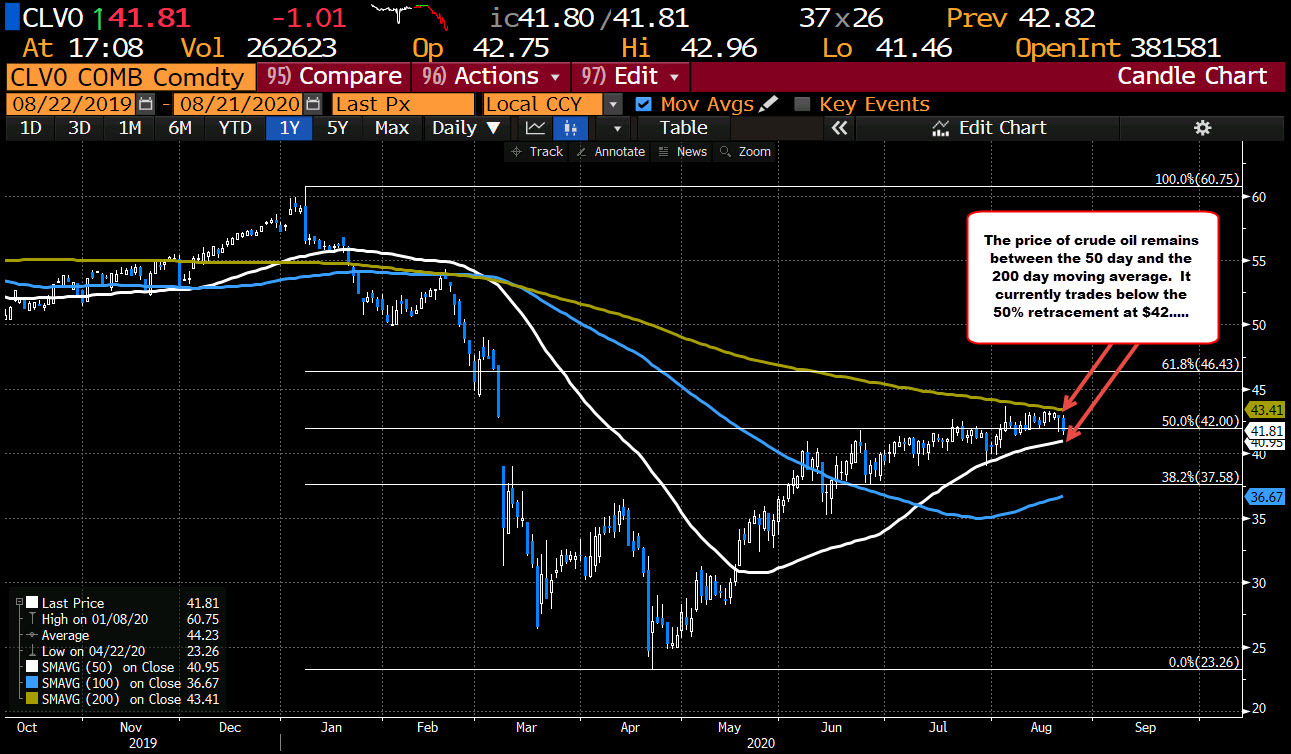
Crude oil is trading at $41.65 for the October contract. That is little changed to the pre-release level.
Looking at the daily chart below, the contract remains above its 50 day average at $40.95 (white moving average line in the chart below) and below its 200 day moving average of $43.41. The range since August 6 as a low $41.33 and a high of $43.29. The low today reached $41.46 just above the low of that range.
In between the moving averages sits the 50% retracement of the 2020 trading range which comes in at even $42. As I type, the price has moved higher and currently trades at $42 – right at that 50% level. Get above and we could see further upside momentum.
At some point, the ups and downs will cease and we will get a break. The moving averages will represent key breakpoints. Focus on those levels.


