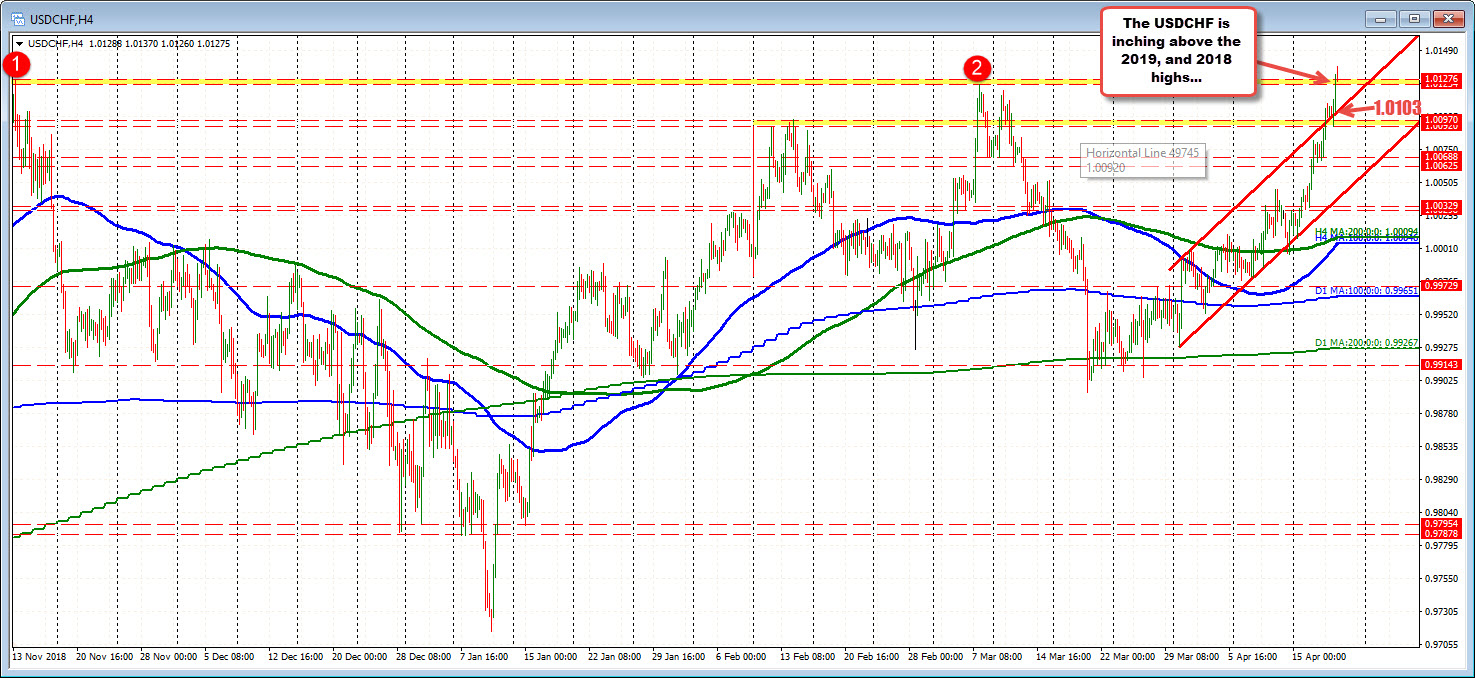
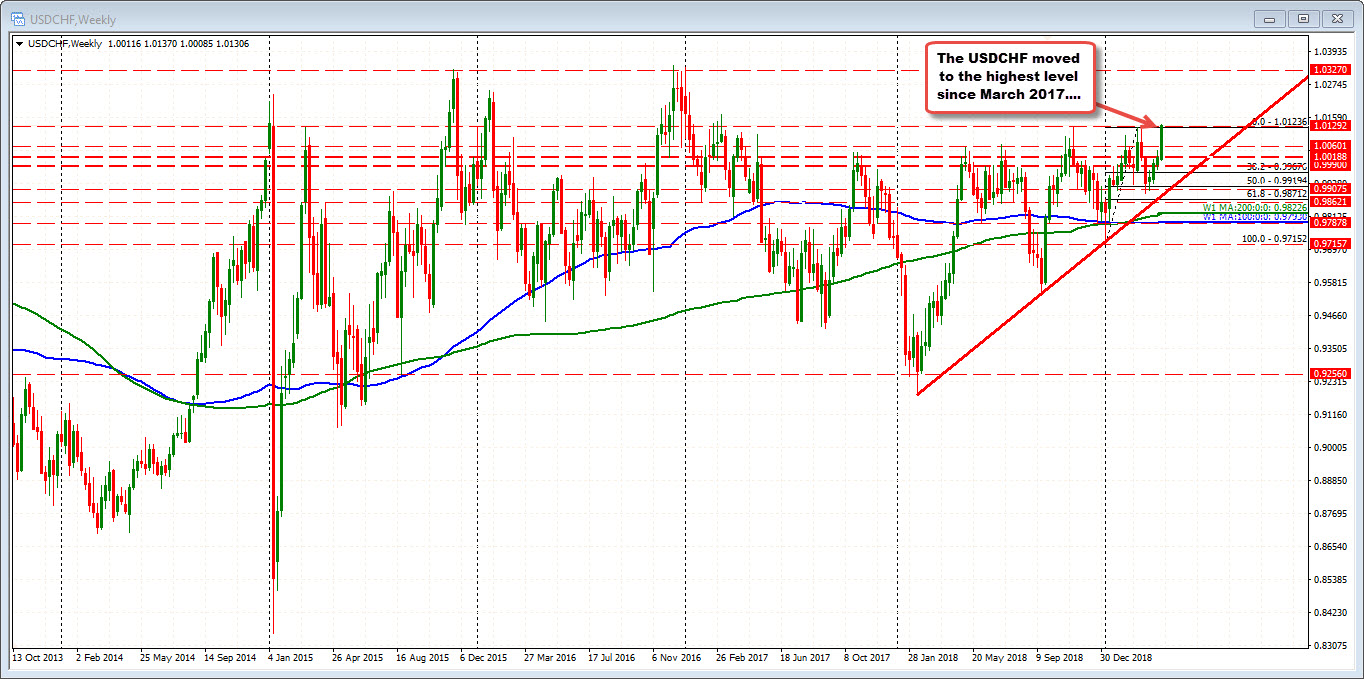
Above 2018 high at 1.01276
The USDCHF moved above the 2018 high at 1.01276 and the March 2019 high at 1.01236. The high reached 1.0137. It is currently trading at 1.0130.
Looking at the 4 hour chart, the pair is moved aboved a channel trend line at 1.0103 currently. That level, and the 1.0092-97 will be levels to get below to weaken the technical bias.
Until, the broken levels give way (one by one), the buyers remain more in control. The pair has been racing higher since the weekend comments from SNB Jordan who said the central bank could still lower rate and/or intervene. The low this week was down at 1.0008.