rss

CFTC Commitments of Traders: Yen shorts ease up

Weekly forex futures net non-commercial positioning data for the week ending May 7, 2019:

  • EUR short 106K vs 105K short last week.  Unchanged
  • GBP short 7K vs 5K short last week. Shorts increased by 3K
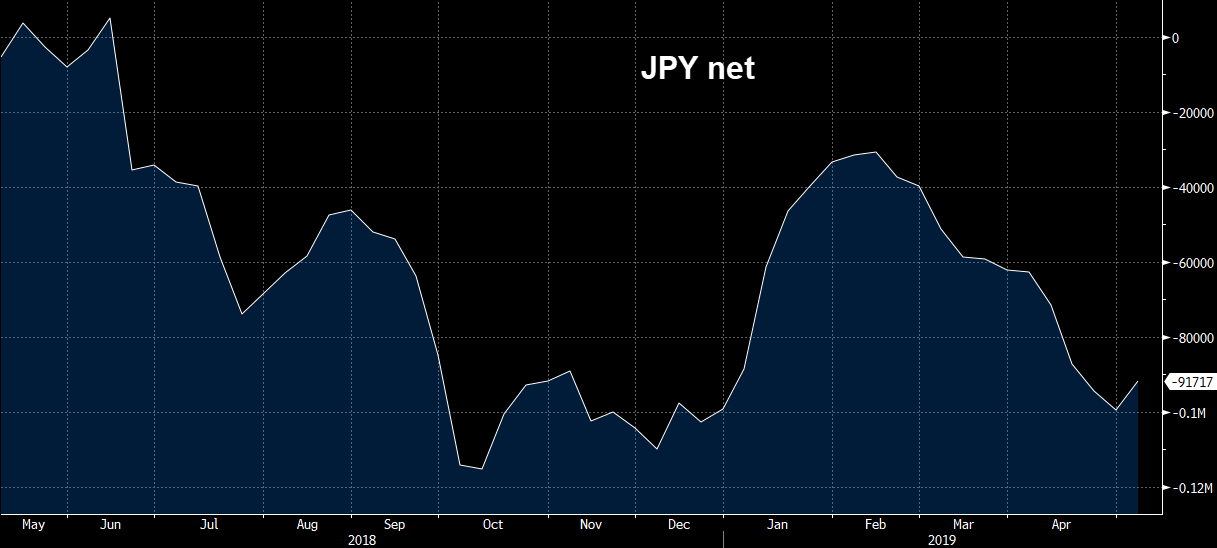
  • JPY short 92K vs 100K short last week. Shorts increased by 6K
  • CHF short 40k vs 40k short last week. Shorts increased by 2K
  • AUD short 57k vs 59k short last week. Shorts increased by 9K
  • NZD short 13K vs 11K short last week. Shorts increased by 6K
  • CAD short 46K vs 47K short last week.  Unchanged
  • Prior report
There were no big themes developing in the latest report. The US dollar remains a heavy favourite of specs and it’s as crowded as ever. The net euro position is the most extreme since Dec 2016.
JPY net positioning

USDJPY stays below a topside trend line.

Lower on the day.  What will stocks do

The USDJPY is staying below a topside trend line today. That comes in at 109.85 currently (and moving lower – see red circles).
Lower on the day.  What will stocks do
I have put a lower trend line in connecting the most recent lows. That comes in at 109.52 currently (and also moving lower).
Below that is an even lower trend line at 109.08 (not shown – line outside of chart above).
Taking a broader look at the daiy chart. The price today moved below the March 25 low at 109.696 on the way to the low. A move back below and staying below that level will be eyed by traders now.  We currently trade at 109.75.
 If you ignore the flash crash from January 3rd, the 61.8% of the move down comes in at 109.372. That is a target on more selling today.
The USDJPY on the daily chart

The USDJPY dips to new session lows on risk off flows

Moves away from 100 day MA

The USDJPY waffled around the 100 day MA for most of the trading day. That was lower from the close yesterday (at 110.76). With stocks trading at/near lows, the USDJPY has seen more risk off lows into the JPY. The GBPJPY and EURJPY are also making new lows in the last few minutes of trading.

Moves away from 100 day MA
Drilling to the 5-minute chart, the pair in the NY session did stall at the 200 bar MA (green line in the chart below) currently at 110.65. That kept shorts more in control intraday. The fall lower has now moved below a lower trend line at 110.49. That is a close risk bias level.

If the price today were to get back above the 38.2-50%  area at 110.567 – 619 area (and the falling 100 and 200 bar MAs (throw in the 100 day MA), the sellers now would likely be spooked. The price should not trade back above those levels if the selling/bearish tilt is to continue.

USDJPY on the5 mintue chart is below trend line now and key MAs

Dollar catches a light bid across the board

EUR/USD has been marked down to a low of 1.1193 from around 1.1210

EUR/USD H1 07-05
The bid in the greenback comes alongside a move higher in the yen as well with USD/JPY inching lower to 110.65 currently. EUR/USD is nearing session lows now as price tests the 100-hour MA (red line) as buyers will now have to show their resolve in defending the near-term bullish bias once again.
Meanwhile, cable is also brought to a session low of 1.3086 after having traded around 1.3110-20 levels earlier at the start of the session. There aren’t any notable headlines for the pick up here as it is taking place just as most European/London traders are getting busy in the morning.
That said, there are some notable changes to risk assets over the past hour with oil prices now down on the day with Brent lower by 0.7% to a low of $70.70. US 10-year yields have also dropped slightly from near 2.50% earlier to 2.48% currently. US equity futures are also slowly surrendering its earlier pullback as it is down by 0.3% now after having pared losses to just under 0.1% earlier.

CFTC commitment of traders:Net long US dollar positions highest since December 2015

Weekly Forex futures that speculative positions from the CFTC

  • Prior report
  • EUR short 105K vs 105K short last week.  Unchanged
  • GBP short 5K vs 2K short last week. Shorts increased by 3K
  • JPY short 100K vs 94K short last week. Shorts increased by 6K
  • CHF short 40k vs 38k short last week. Shorts increased by 2K
  • AUD short 59k vs 50k short last week. Shorts increased by 9K
  • NZD short 11K vs 5K short last week. Shorts increased by 6K
  • CAD short 47K vs 47K short last week.  Unchanged

US dollar edges higher after PCE report

Dollar generally subdued

The US dollar has ticked higher after the March PCE report.
A few of the elements in the data balance out. Inflation was once-again soft but that was foreshadowed in Friday’s GDP report so it doesn’t come as a big surprise.
In terms of consumers, spending was surprisingly strong but income levels fell well short of what was expected.
So there’s a long list of a pros and cons after the report and the dollar is generally mixed. USD/JPY ticked higher to 111.82 from 111.72 beforehand:
Dollar generally subdued
Part of that is a creep higher in Treasury yields. US 10s are up 3 bps to 2.53%. The euro and pound also hit the lows of European trading on the headlines.
On the flipside, the commodity currencies are doing a bit better against the US dollar after the report.
For the next move in the dollar, look to equities and commodity prices.

An Update :Dollar Index ,Euro ,JPY ,AUD ,INR ,GBP ,CAD ,Brent ,WTI ,SPX ,Nasdaq Composite ,DJIA ,Shanghai Composite -ANIRUDH SETHI

By all reckoning, the US dollar had a good week.  It rose against nearly all the major currencies, and against many broke out of recent ranges.  Ironically, the dollar gains more mostly scored before the surprisingly strong Q1 GDP print of 3.2%.  In fact, all the major currencies but the Norwegian krone recouped some of their recent losses ahead of the weekend.  Nokkie appeared to have been weighed down by the biggest drop in oil prices in a couple of months after setting six-month highs earlier in the week after the US announced it was not going to renew any waivers that exempted a handful of countries from the embargo against Iran.
Some purists argue that just like space has a shape so does nature.  Technical analysis is about uncovering these shapes in prices.  Fibonacci relationships exist in nature, for example,  they can be found in the markets too.  Another school argues that technical analysis is a study of group psychology.  Individuals may learn, but groups apparently do not, and behavior (patterns) are often repeated.  Two elements of market psychology have percolated into pop culture.
   To read more enter password and Unlock more engaging content

EURUSD trades to swing low targets going back to 2017

Sellers remain in control

The EURUSD sellers remain in control. The price has moved down to a low of 1.1117.  Going back to May and June 2017, there were swing lows at 1.1108 and 1.1118 before the pair started the push higher (ending up at 1.12555 in February 2018).
Sellers remain in control in the EURUSD on the daily but testing a swing area.
Staying on the daily chart, if the support lows do not hold the next target would be down at 1.1054. That is the lower trend line connecting lows going back to October 2017, August 2018, November 2018 (see green numbered circles).
Drilling to the hourly chart, in addition to the 1.1108-18 area from the daily, a lower trend line connecting recent lows cuts across at 1.1104 (and moving lower). That too should be considered as a level to get below for the trend to continue it’s run.
A topside trend line on the same chart comes in at 1.1142 (see chart below).
(more…)
Go to top