rss

USDCHF test the low close going back to 2018

Lows close going back to 2018 was at 0.92176. The low today reached 0.92184.

The USDCHF this week peaked on Monday at 0.94093. That that high was just below the 200 hour moving average at 0.9411. Sellers leaned against that level and it took until Tuesday to break below a floor area between 0.93618 and 0.93701 (see yellow area) to get the ball rolling more to the downside.

Lows close going back to 2018 was at 0.92176. The low today reached 0.92184.

Each day this week has moved lower. The close from yesterday came in at 0.9252. That was just above the low closing price for the year (2020) at 0.9250.
Today the price did trade briefly higher to a high of 0.92598, but over the last 8 or so hours has moved back to the downside. In the process the price has traded to the lowest level going back to March 9. The low for the day reached 0.92184.
For your guide the lowest close going back to 2018 comes in at 0.92176. Like yesterday when the price tested the 2020 year low close, today’s low came just above the low close from 2018. Buyers are trying to lean against the 2018 low close like they tried to lean against the 2020 low yesterday.
A break below that level would open the door for a retest of the March 2020 low of 0.91747.
USDCHF on the hourly chart

More on that EUR/USD forecasts raised …. to 1.12! (not a typo)

Bank of America Global Research discusses EUR/USD outlook and now targets the pair at 1.12 in Q3 and 1.08 by year-end.

EURUSD is close to its high for the year. We remain sceptical. The market is long EURUSD and this position could be at risk, particularly for real money. We expect a weak recovery of the global economy during re-opening and dont see full normalization as long as the virus is a threat. The EU Recovery Fund is a positive step, but far from a game changer in our view, an 1-off increase in the EU budget that allows the EU to catch up to the fiscal stimulus other G10 economies have been doingwith the US doing more. Although the US recovery may slow in the months ahead, we do not expect another shutdown,” BofA notes. 

“As the market has moved in a different direction from our forecasts, we update our forecasts, marking to market. We now expect EURUSD at 1.12 in Q3 from 1.08 before and 1.08 in Q4 from 1.05 before. We keep our 2021 EURUSD forecast at 1.15.We therefore retain a bearish EURUSD bias, to a large extent because of our positive USD view, which in turn is based on a bearish outlook for the global economy,” BofA adds. 

I posted earlier on BoA and their EUR forecast out to year end:

EURUSD extends above the $1.160

EURUSD also above the 50% retracement at 1.15958

The price of the EURUSD has broken above the 50% retracement of the move down from the 2018 high at 1.15958. The pair has also moved above the 1.1600 level in the process.  That was the high price from yesterday’s trade. The high price has extended to 1.1626 after the break.
EURUSD also above the 50% retracement at 1.15958

Drilling to the hourly chart, at the start of the session, the EURUSD moved below the swing lows in the 1.15594 area (see chart below).  Staying below that level would have kept the sellers in control and would have would have opened the door for a further probe down toward the 38.2% retracement and rising 100 hour moving average (blue line on in the chart below).

That did not play out. The price moved back above the 1.15594 and started it’s move back to the upside.
Admittedly there was some up and down around the 1.1600 level with the 1st break failing.  However the 2nd run higher was accompanied with more upside momentum.
Risk now is the 1.1595-1.1600.  Traders would not want to see a reversal back down below that area after breaking.
EURSUD on the hourly chart

Daily thread to exchange ideas and to share your thoughts

Major currency movement has been a little more subdued to start the day but the action should pick up soon enough and more so as we look towards North American trading later, following the moves that we saw in overnight trading.

WCRS 22-07

Dollar pairs are the heavy focus as the risk mood remains more positive for the most part, despite the Nasdaq seeing a bit of a setback yesterday.
EUR/USD broke above 1.1500 for the first time since January 2019, GBP/USD moved above 1.2700 and its 200-day MA, USD/CAD fell below 1.3500 and its 200-day MA, AUD/USD aiming for 0.7200 on a break to fresh highs since April 2019, and NZD/USD firmly broke above 0.6600 to its highest levels since January.
As such, the focus remains on risk sentiment as we look towards the sessions ahead. European trading may be more quiet today but US trading should offer more once again, with the moves in Wall Street a key factor driving trading sentiment.
Elsewhere, gold and silver are continuing to break higher as well and are showing little signs of slowing down amid the dollar rout. The silver move is particularly impressive but I’d be mindful of any “too far, too fast” moves in commodities.
The pullback can be brutal at times. So, remember to manage risk levels accordingly.

USD facing more questions about its status as the primary reserve currency

Here is an item on the US dollar from Bloomberg that may be of interest.

It cites analysts from Credit Agricole and Mizuho
  • USD accounts for more than 60% of global reserves
  • the most widely used currency for international transactions
  • But it risks ceding ground to the euro after European Union leaders agreed on a 750 billion euro stimulus package that enhances the appeal of the shared currency and euro-denominated assets
CA say that the recovery fund will facilitate diversification out of the US dollar
offering liquid, high-rating, euro-denominated debt
Here is an item on the US dollar from Bloomberg that may be of interest.
I’d not be getting too gung-ho on this, and note that the analysts say ‘risks ceding ground’, they are not writing off the dollar.

EURUSD trades to the highest level since January 2019

Takes out 2020 high 1.14918

The EURUSD has trade above the March 2020 high price at 1.14918. The high price just traded to 1.1493. The new high for the year takes the price to the highest level since the end of January 2019. The high price on January 31 reach 1.15137. That is the next target for the pair.

Takes out 2020 high 1.14918_

In addition to extending to a new high going back to February 2019, the price last week moved above its 38.2% retracement at 1.13694, and stayed above that level. That is now a risk level for longs.
The 50% midpoint of the move down from the 2018 high comes in at 1.15958. That is now a target on the topside. An interim target from the daily chart, comes in at 1.1569. That level is the high from January 10, 2018. Buyers remain in control.

EURUSD has 2.6B of option expires at 1.1400

Expiration at the top of the hour.

FYI, the EURUSD just reached to a a new session low of 1.14016. That was just above the 1.1400 level where 2.643B of options expire.
Traders at sell options that expire at the strike price in the most. With a large amount expiring, they may be helping to drive the EURUSD toward that level at expiration in just a few minutes.
The price has moved from a New York session high of 1.1463 down to the 1.1401. We currently trade at 1.1413. As a result those options sellers may have already done most of the hard lifting

into the expiration

EURUSD rotates back to the downside

New 4 month high fails

The EURUSD moved to the highest level in 4 months in trading today (since March 9). The high today, took out the highs from last week at 1.14512, and reached a high of 1.14672. That was short of the March and 2020 high price of 1.14918.
New 4 month high fails
That was a good news. The bad news is that the rise to the four-month high – and above the swing highs from last week – has failed. The price has rotated back down toward its 100 hour moving average. That moving average currently comes in at 1.14112. Last week on Thursday and Friday, the price tried to move back below that MA line (see blue line on the chart below) and those efforts all failed.
The EURUSD on the hourly chart.

Do the buyers come in against the trend line?  Risk can be defined and limited and the recent history shows support buyers against the moving average level.  As a result we should see some dip buying. However, a will below should solicit more downside potential. The 38.2% retracement of the move up from the July 10 low comes in at 1.13858.  That would be a potential target.

On the topside now the swing highs from last week between 1.1441 and 1.41509 should be resistance now that the break higher failed.

What to look out for in the week ahead?

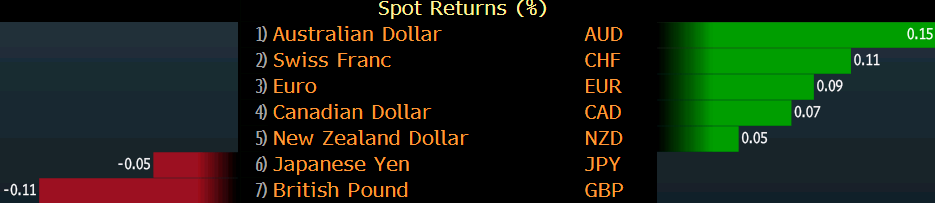
As we turn to UK/EU trade moves in FX markets been a rather quiet affair despite the EU Summit having given us little to work with.

I have no firm intel on when we get full confirmation and the outcome but we’re now heading into the fourth day of the marathon talks, but at this point it appears we’re getting closer to a deal, with the level of grants the key sticking point and rumoured to be around E390b.

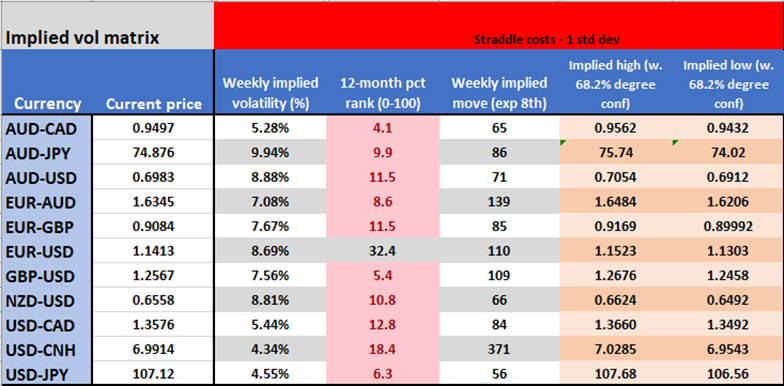
EUR implied volatility (vol) has been rising of late, as we can see this in the weekly implied volatility scan, with EURUSD 1-week vol pushing into the 32nd percentile of the 12-month range.

This puts EURUSD in an expected range this week of 1.1523 to 1.1303, with a 68% level of confidence. Once again last weeks implied move/range offered a solid guide for mean reversion traders, or those just looking to manage risk more effectively.

(Weekly vol matrix – snapshot from Friday’s close)

PS2
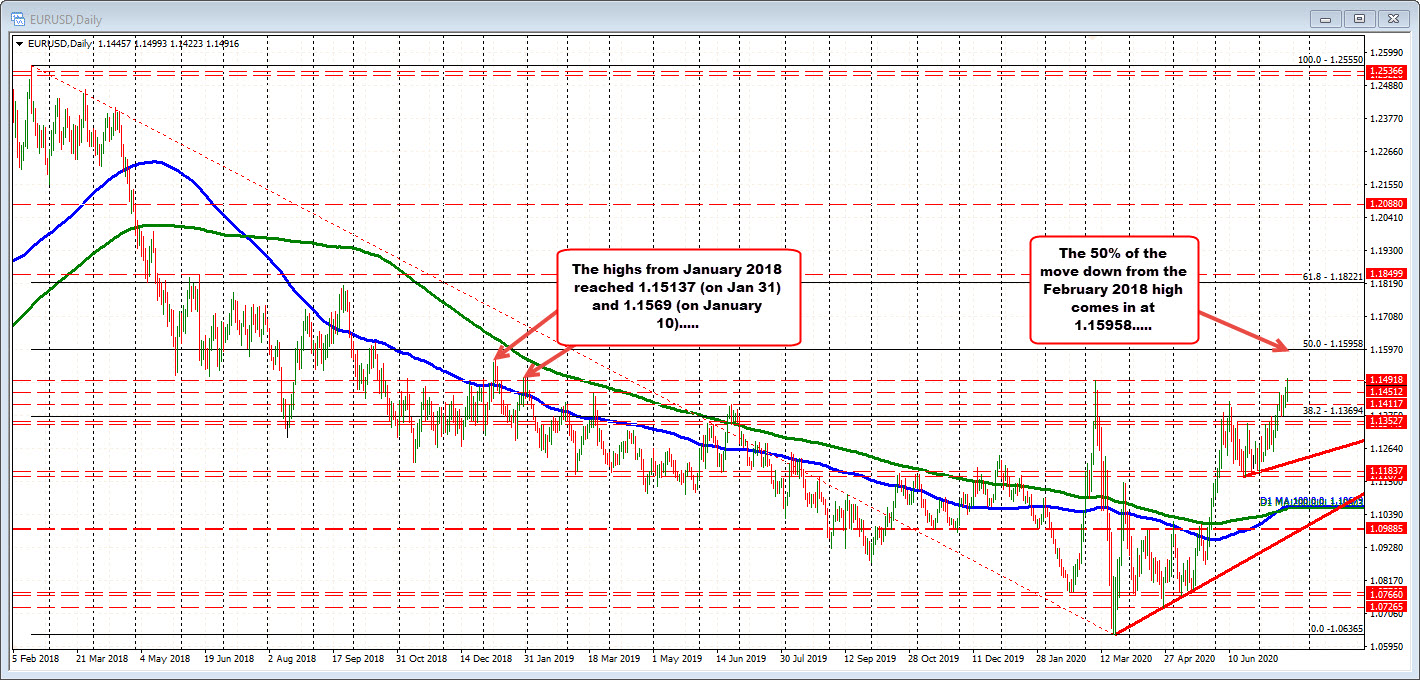
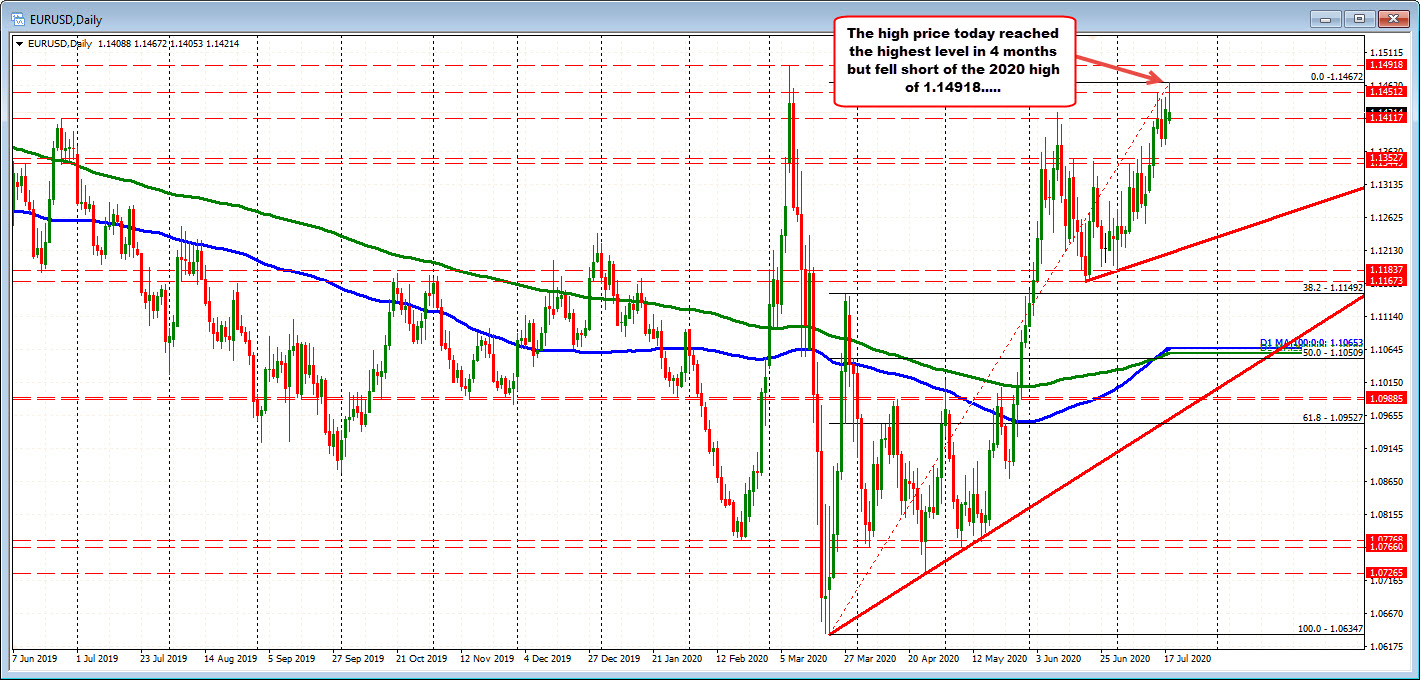
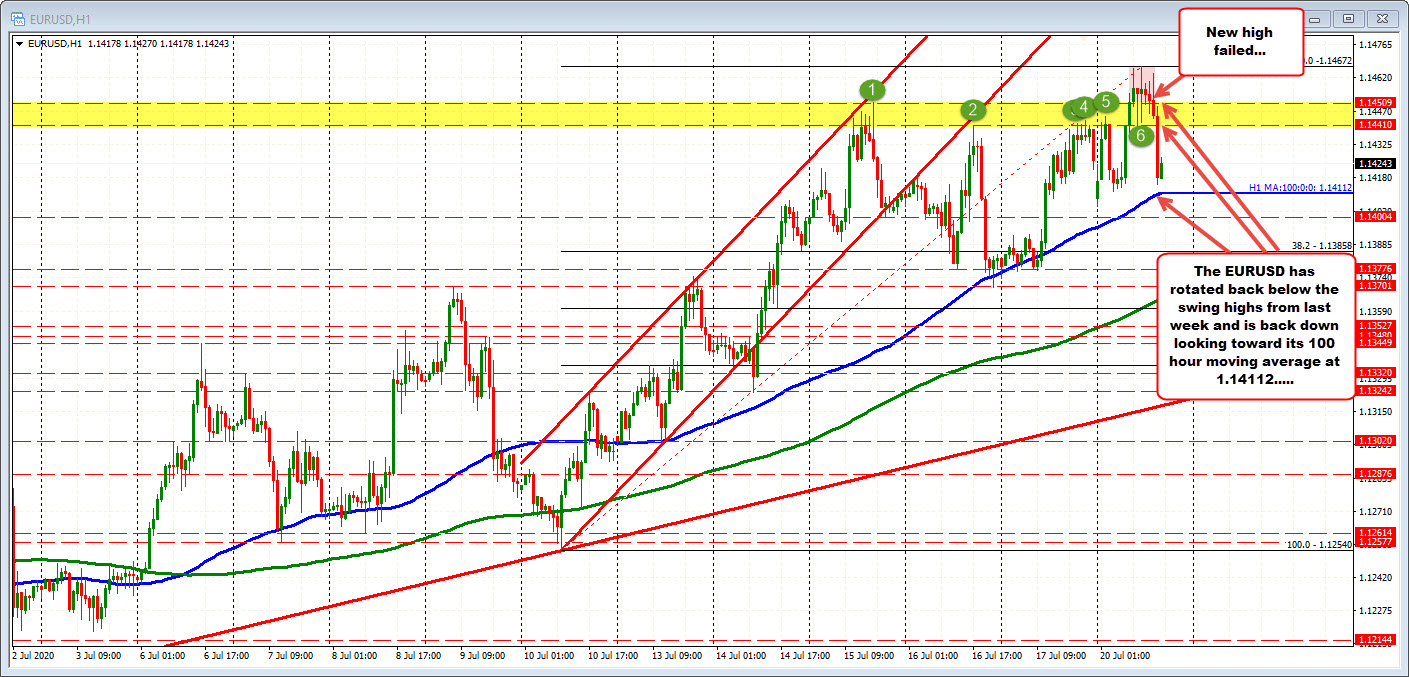
Traders were net buyers of the single currency on Friday into the EU Council meeting, with EURUSD testing 1.1447 – a level I’ve marked as core to markets – a weekly close through here could hold huge implications for global markets and take the USDX through 95.78.

EURGBP is also getting some good interest, with price having pushed into 0.9134 before finding good supply – I have this on this cross on the radar as the buyers are back in control here and we have Fridays high in our sights. A break of 0.134 would be clearly bullish.

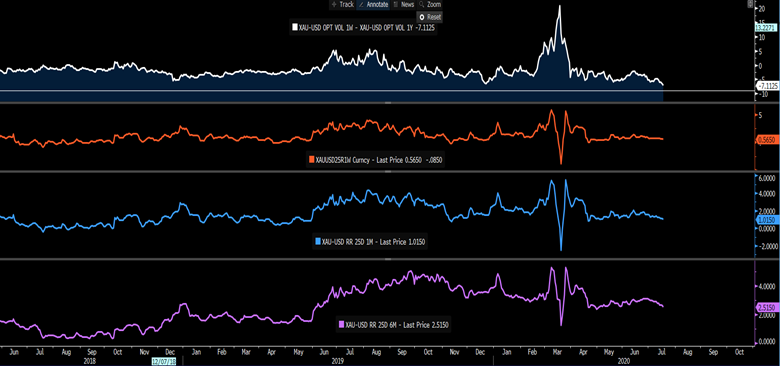
Options traders extremely neutral on gold moves

Gold is on the radar too, with the USD firmly at the centre of the thought-process today.

Moves today should be sanguine, and if I look at the options markets I see 1-week implied volatility falling to a 7 vol discount to 1-year vol – the lowest since 2013 – showing a belief that near-term moves in gold will be incredibly subdued and a grind. I also see 1-week risk reversals at 0.56, and 1-month risk reversals at 1.015 – effectively, the options markets is about as neutral on the metal as I have seen in some time – a move through 1813, and into new cycle highs, possibly changes that dynamic and see traders looking for a more explosive move in price.

PS3

Still upbeat on equities but fiscal debates offer new challenges

On the index side, the weekly chart of US500 looks constructive, and despite earnings season ramping up this week, the feel the technical side is suggestive of further upside. The risk for the market this week is on the fiscal side and equities could be sensitive to the news flow and one suspects it will not be smooth sailing.

Staying in the vol space and we see equity vol headed lower, with the cash VIX -2.3 vols on Friday and into 25.68% – closing below its 200-day MA, which is something it failed to do throughout the various tests in June. Our VIX index tracks the VIX futures and is approaching the June lows – one to watch as lower equity vol is saying we’re moving into the US summer doldrums and is having an effect in FX markets. (more…)

Go to top