rss

USDCAD falls below floor. Tests 2018 low.

2018 low is at 1.22455

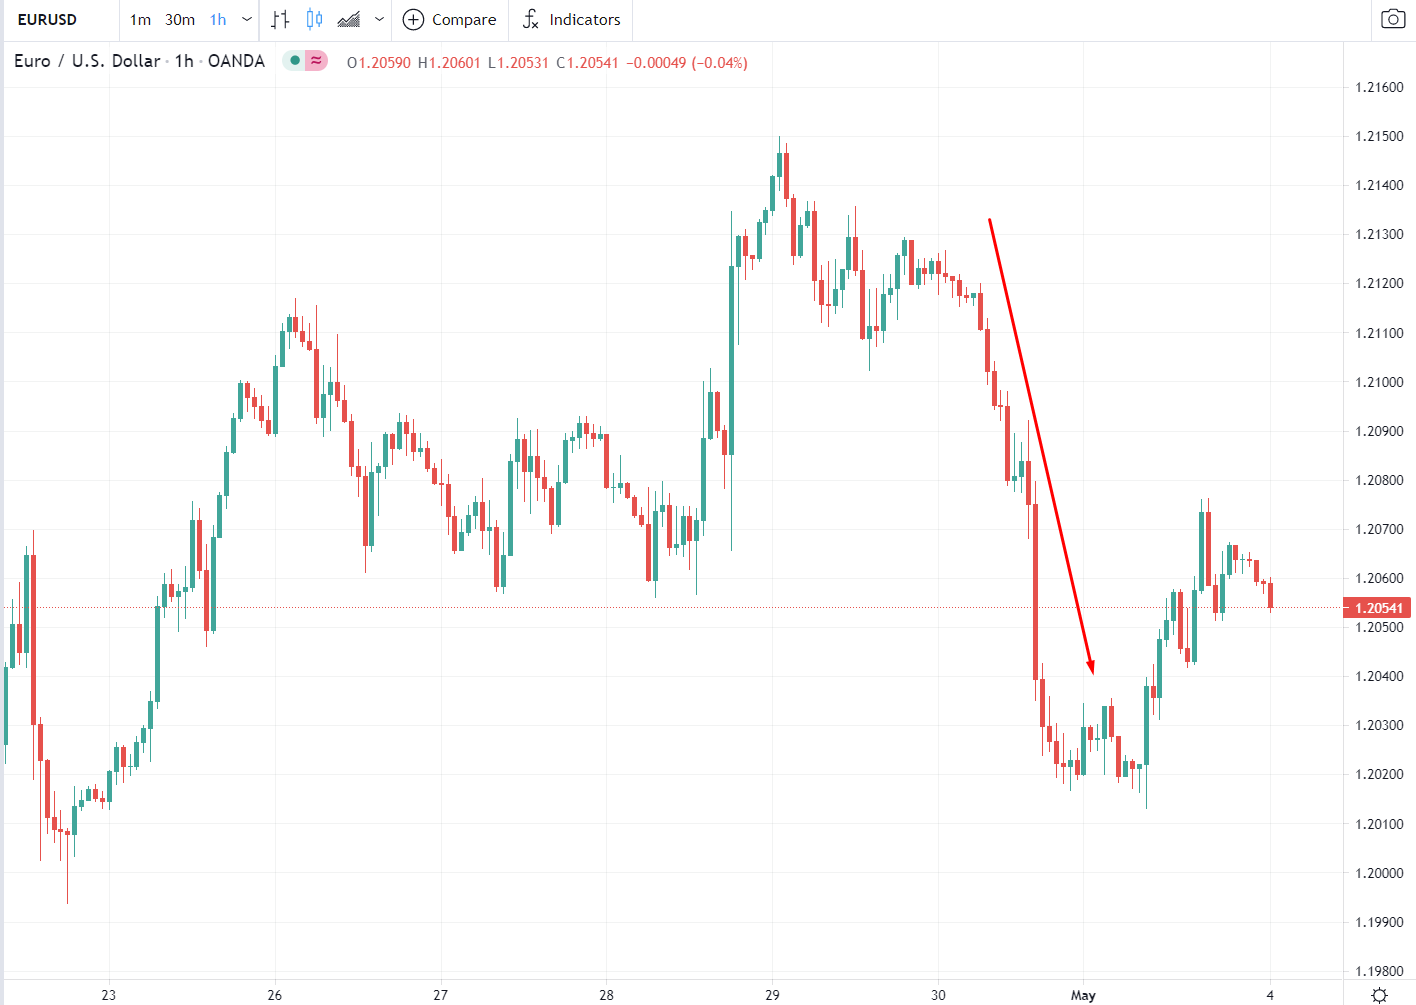
The USDCAD has fallen below a floor from recent lows on Friday, Monday and again today (see red numbered circles in the hourly chart below). That floor was at 1.22652.
The break has seen the price move down to a new 2021 low of 1.22527 (so far).  Stay below the old floor keeps the sellers firmly in control.
If the price is able to get back above the floor, the buyers would still need to still move the price back above its 100 hour moving average at 1.22895.  That moving average was broken yesterday, and again earlier today (after a dip below). The high price yesterday stalled well ahead of the falling 200 hour moving average (green line), and ran out of upside steam.

2018 low is at 1.22455_

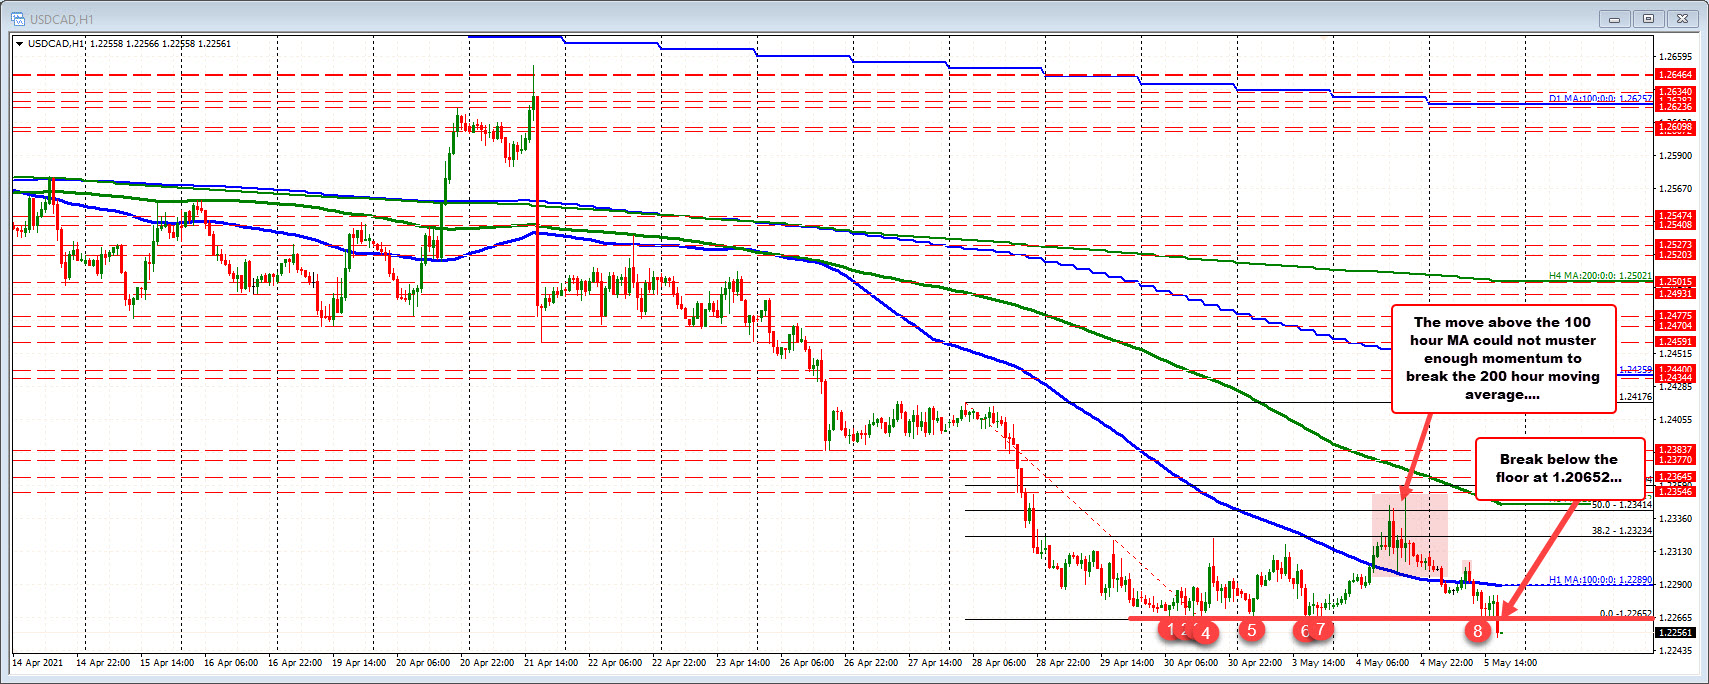
If the price can remain below the old floor and falling 100 hour moving average, what next for the pair?

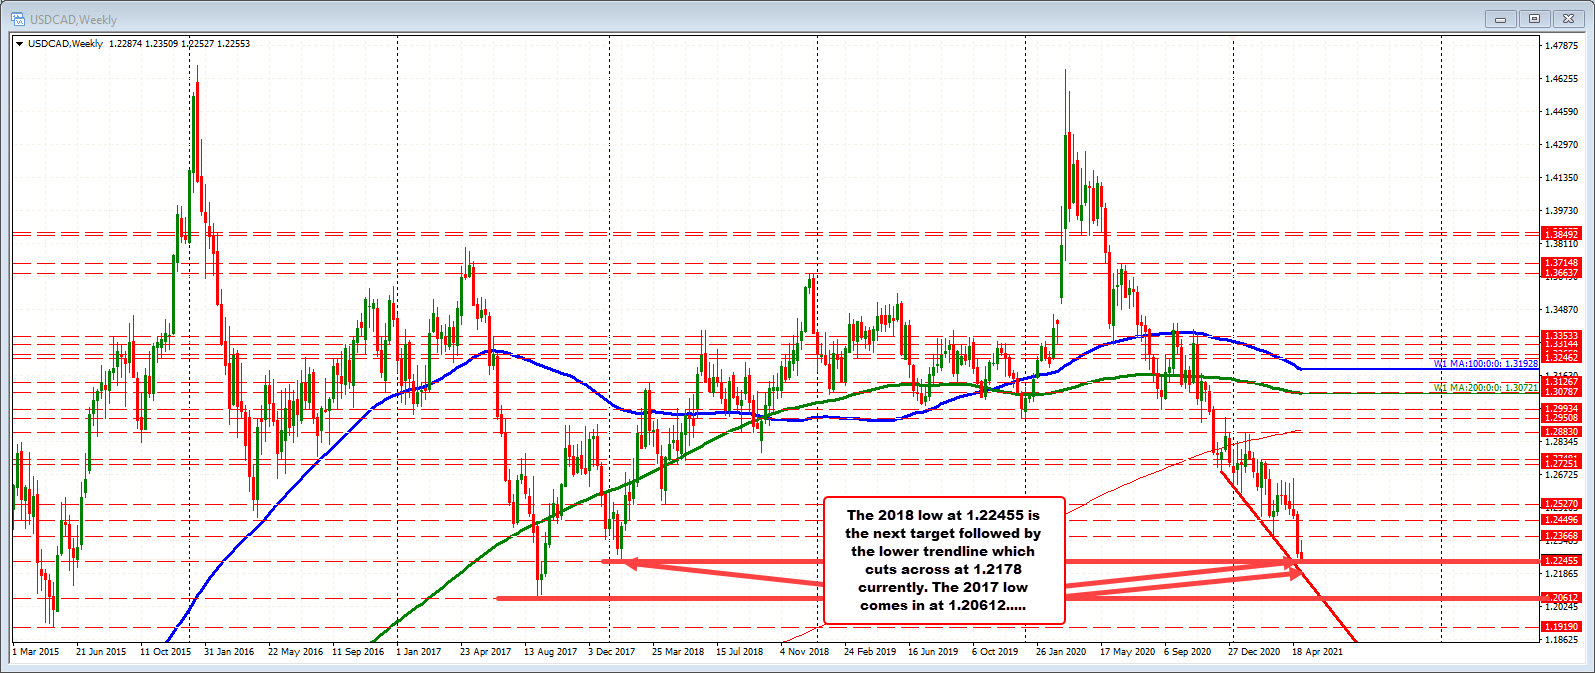
Taking a broader look at the weekly chart, although the price fell below a key floor on the hourly chart, it is also approaching another key level at the 2018 low price of 1.22455.  So  there is another key target to get to and through.  There is more work to do for the sellers.

Nevertheless, if that level can be broken, headlines will read and that the USDCAD is now trading at the lowest level since September 2017. Bearish.
The next target would then be a lower trendline that cuts across at 1.2178 on the weekly chart. Move below that level, and  the 2017 low would be eyed at 1.20612.
Sellers remain in firm control below the hourly floor at 1.22652. However, getting below the 2018 low at 1.22455 is still a key target to get to and through if the sellers are to continue to run to the downside for the USDCAD.
USDCAD on the weekly chart

EURUSD trades back down toward low for the day

Tests a swing area between 1.1987 and 1.19943

The price of the EURUSD as seen down and up and back down action in trading today. The low to high trading range is only 41 pips. The 20 dude day average is 62 pips. There is room to roam.
Tests a swing area between 1.1987 and 1.19943_
The current price is trading around 1.1995. The 1.1987 to 1.19943 area is a swing area which was a ceiling going back to April 14 until it broke higher on April 19.  The old ceiling was retested on April 22, and held support (see red numbered circle 5).  The lows today have been retesting that area and finding some cause for pause.  A move below, and then below the 38.2% retracement of the move up from March 31 low at 1.19792, would have traders targeting the 200 day moving average and a lower swing area (see green numbered circles) between 1.19414 and 1.19506.
What would hurt the bearish bias?
  • Not being able to get below 1.1987, and/or
  • moving back above a swing area between 1.20125 and 1.20209 (see blue numbered circles in the chart above).
The EURUSD trended higher from the March 31 low to the hi reached on April 29. Three of the last four trading days have been to the downside (today the price is lower as well).  On Monday, the pair retested its 200 hour moving average – peeking above the level briefly before rotating back to the downside.  Yesterday, the price moved back below its 100 day moving average at 1.2050 currently and ran further away from that key moving average level.
The move higher in April took bullish steps along the way, that become target steps on the way down as well (yellow areas).

Dollar holds firmer to start the session

Dollar extends its advance to start European morning trade

The greenback is holding modest gains across the board to kick start the session, paring its drop from yesterday. EUR/USD is trading down to the lows at 1.2018, closing in on the Monday lows around 1.2013-15 at the moment:

EUR/USD D1 04-05
Sellers are keeping near-term control and the push back below the 100-day moving average (red line) provides more conviction for an added downside push, potentially to test the 1.2000 handle as London traders return after the long weekend.

(more…)

US Dollar keeps more mixed so far on the session

Dollar trails slightly behind the euro, pound but gains against the yen, loonie

It has been a relatively quiet start to May proceedings as holidays in Japan, China, and now UK are keeping the market more tepid so far today.
Major currencies are mostly little changed in general, though the yen is the notable laggard as USD/JPY hovers near the highs for the day at 109.68 currently.
Besides that, USD/CAD is a little higher at 1.2300-10 but the rest of the major currencies bloc are keeping in narrower ranges. EUR/USD is hovering around 1.2030 levels now but is holding within a 29 pips range (1.2013-42) in trading today.
US futures are keeping higher (S&P 500 futures up 0.5%) so keep that in mind in case there is more of a risk-on push later when Wall Street starts to enter the fray.

CFTC Commitments of Traders: The slow CAD courtship continues

Weekly forex futures positioning data from the CFTC for the week ending April 27, 2021:

Weekly forex futures positioning data from the CFTC for the week ending April 27, 2021:
  • EUR long 81K vs 81K long last week. No change
  • GBP long 29K vs 25K long last week. Longs increase by 4K
  • JPY short 49K vs 60K short last week. Shorts decreased by 11K
  • CHF short 1K vs 2K short last week. Shorts decreased by 1K
  • AUD short 1K vs 2K short last week. Shorts decreased by 1K.
  • NZD long 7K vs 4K long last week. Longs increased by 3K
  • CAD long 16K vs 13K long last week. Longs increased by 3K
The Canadian loon mates for life but the currency market has been slow to fall in love with loonie. Longs rose 11K last week and that was before the BOC. After the decision, buyers dipped another toe in but there’s plenty of room to run here. CAD longs are still below the February highs and miles away from the 2019 net long of +54K.

US dollar resumes slide following the Fed statement

Initial reaction is USD selling

There isn’t much to digest in the FOMC decision. There were no actions or changes to guidance. Powell will take questions shortly but if the statement is any indication, he’s not going to offer anything new.
The early market reaction is modest US dollar selling. Some of that is a continuation of what we saw in the run-up to the decision. Then in the short-time before it there was some squaring up. Now it looks to have resumed.
Initial reaction is USD selling
There’s not much temptation to wade into positions until after Powell.
The Fed funds futures market is pricing in the first hike in March 2023.

US dollar comes under pressure ahead of the FOMC

Fed jitters fade

The US dollar is coming under some broad selling pressure with approx 20 pip moves against other currencies.
EUR/USD is quickly up to 1.2088 from 1.2068 but the move is universal. It comes with Treasury yields falling back to flat on the day and a decent bid in equities.
Fed jitters fade
It’s Fed day so volumes in FX are likely light but this shows little fear of a Powell hint at a taper.
Keep an eye on USD/CAD as it approaches the March low of 1.2365. There may be stops below.

USD/JPY ticks to a one-week high as Treasury yields edge up

USD/JPY hits a session high

USD/JPY hits a session high
It’s tough to find big movers in the FX market but yen crosses are making headway. USD/JPY edged above the earlier session high to a one-week high. It’s is up 37 pips to 108.44.
The latest data slate had little impact with the focus narrowing on the Fed. Some support is coming from the bond market, where US 10-year yields are up 2 bps to 1.588%. I could see a further climb in the day ahead on Fed jitters and that would keep USD/JPY bid.
Technically, there’s an ongoing turn in USD/JPY but it’s running into the early March lows, which should offer some modest resistance.
Go to top