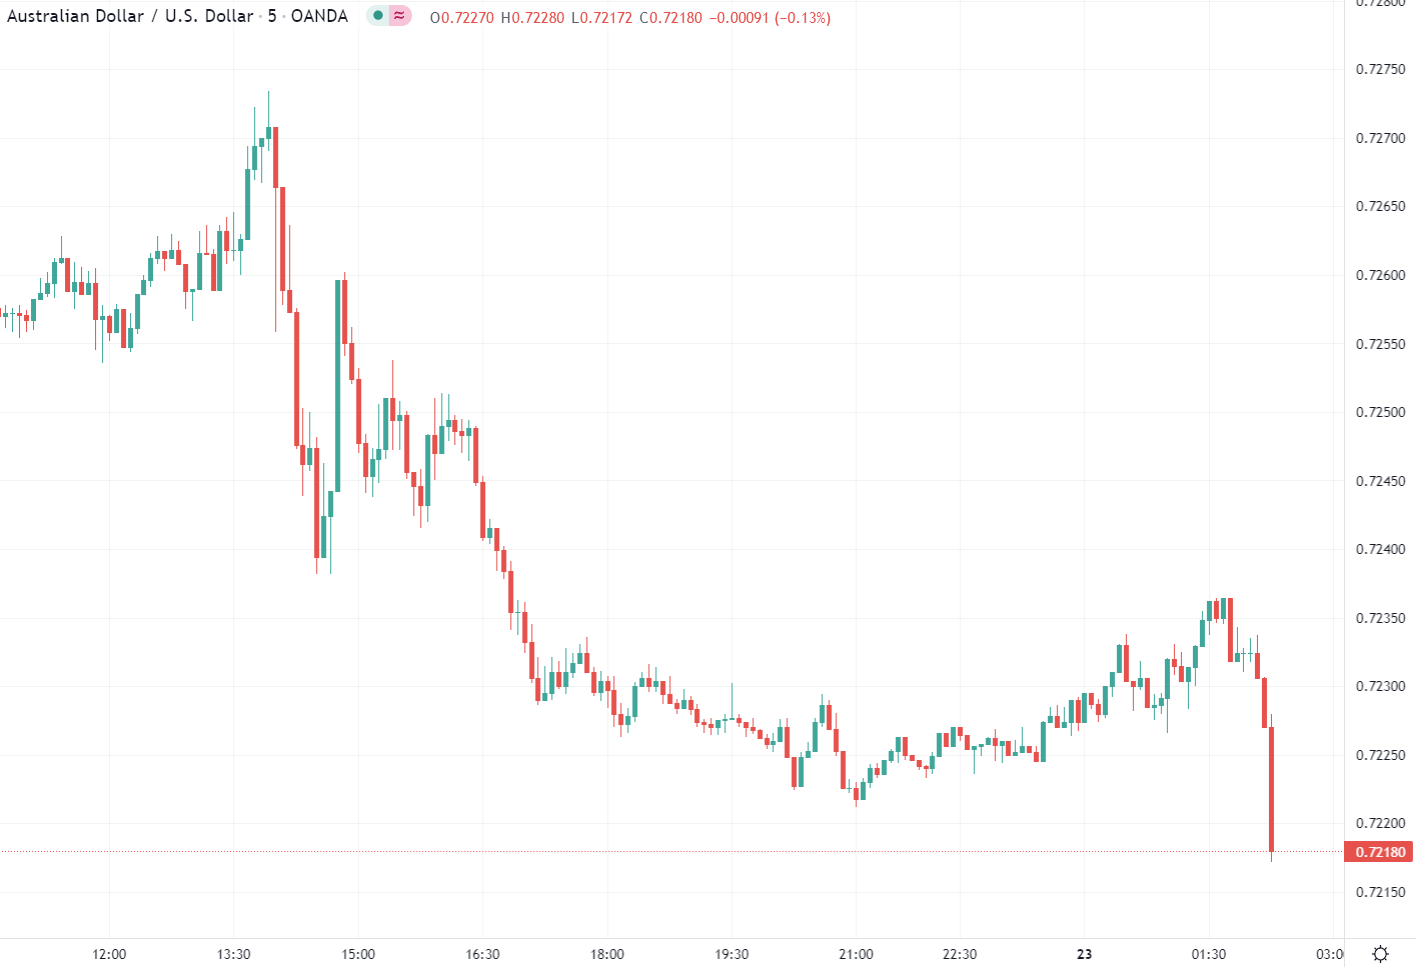
Rates open lower
The US bond market was closed for Thanksgiving but opened again just after midnight GMT and yields fell 3-6 basis points across the curve.
My suspicion is that this is all about worries about the new covid variant but whatever it is, and despite an extremely thin market, it’s dominating price action in everything.
In FX, USD/JPY has fallen 50 pips on the rate move:
At times, price action can create narrative and I think we’re going to be hearing much more above covid in the day ahead because some South African officials have sounded the alarm.


/GettyImages-483658563-fbe002bf7f6d467a94d87cd153ddfa73.jpg)

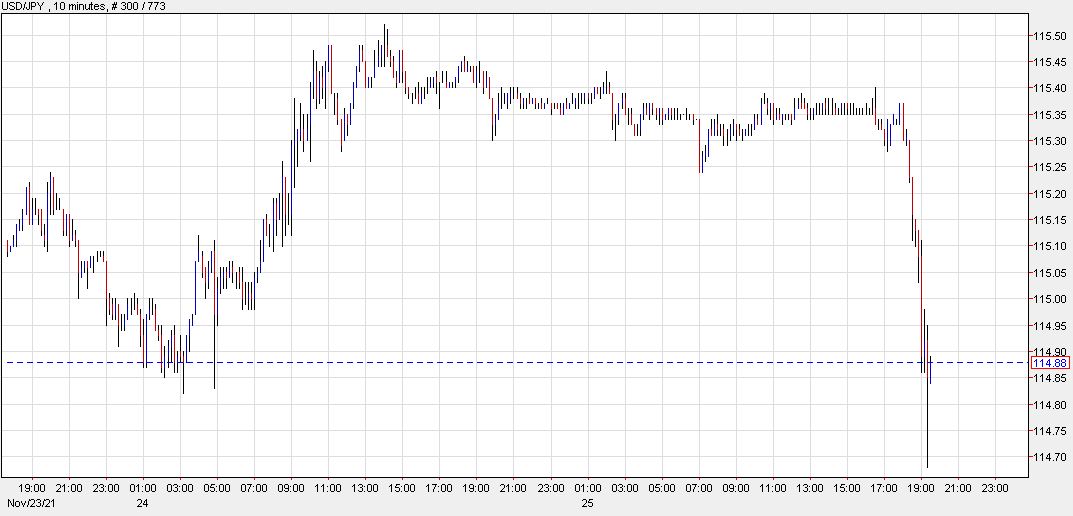
 US10Y correlationWith the BoJ so bearish the rate differentials between the Japanese 10y and the US 10 y are usually just seen in the ebbs and flows of the US 10 y. Remember that the BoJ has yield curve control on their bond yields. So, the key point to note is this:A falling US10Y = a rising JPYA rising US10Y = a falling JPY
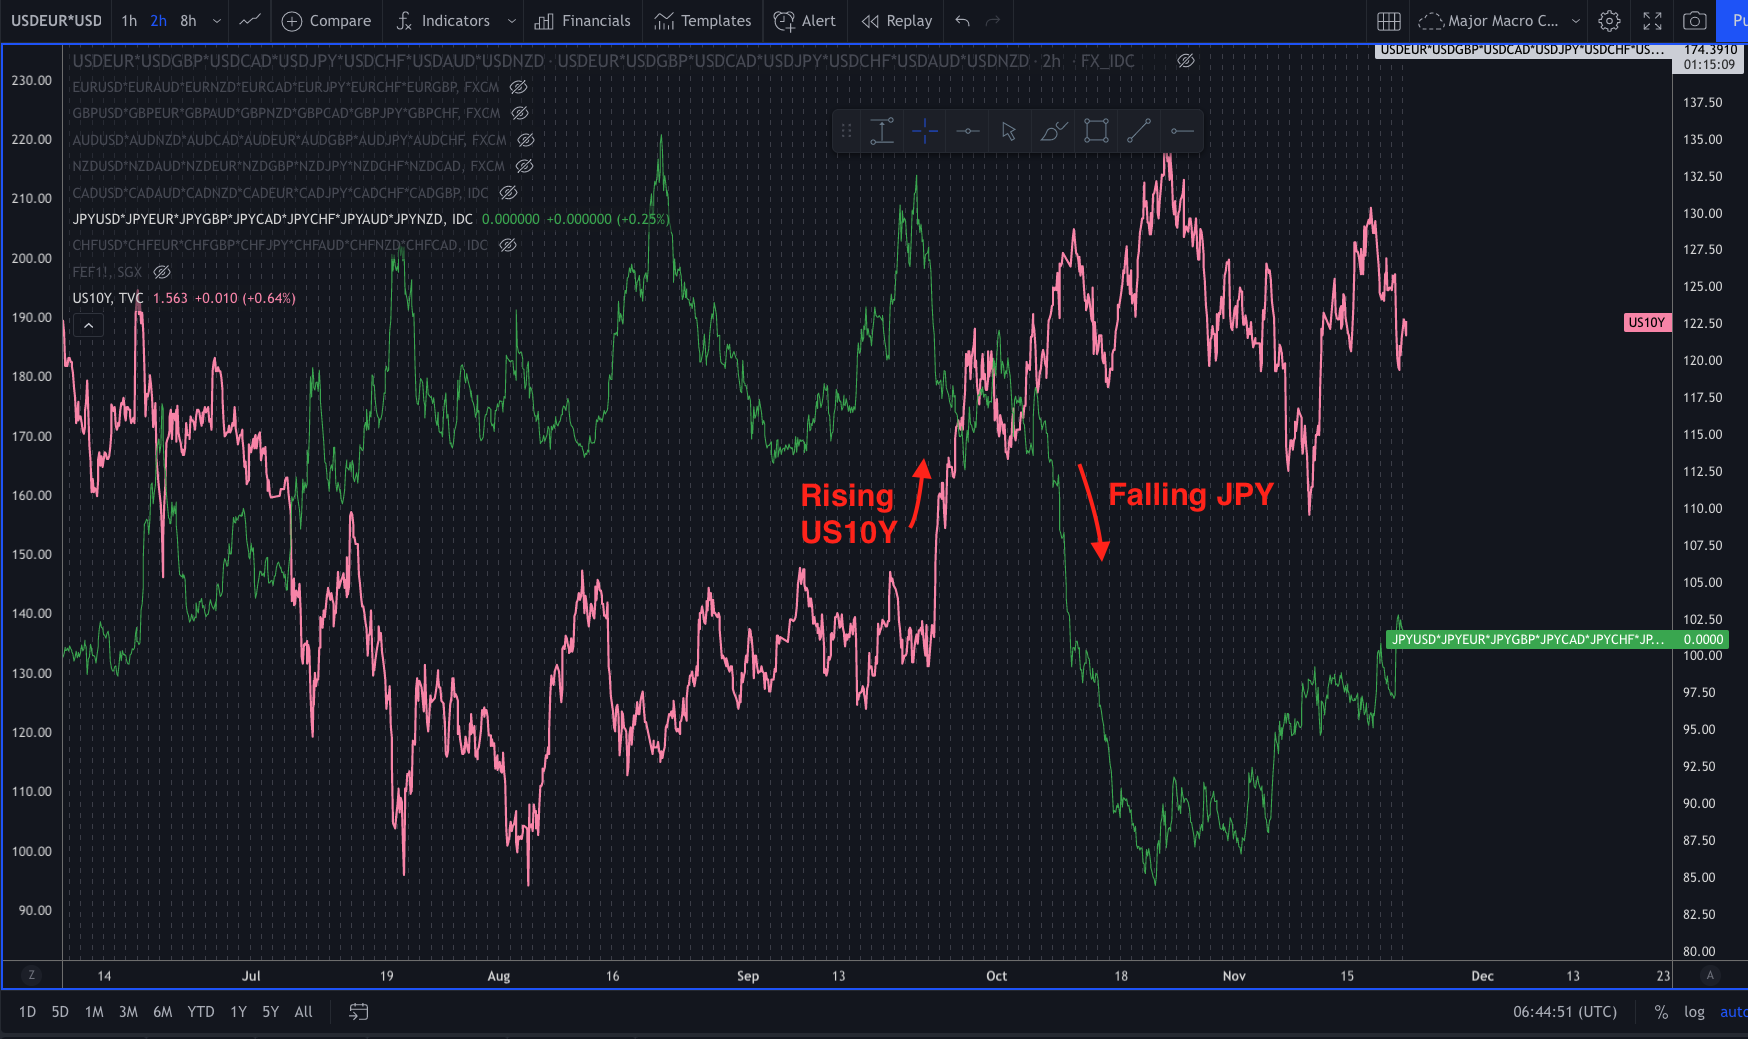 This correlation is not always perfect as it can ebb and flow, but it is a correlation to be aware of when trading the JPY and in particular the USDJPY. Look at the USDJPY chart below and its close correlation with US10y.
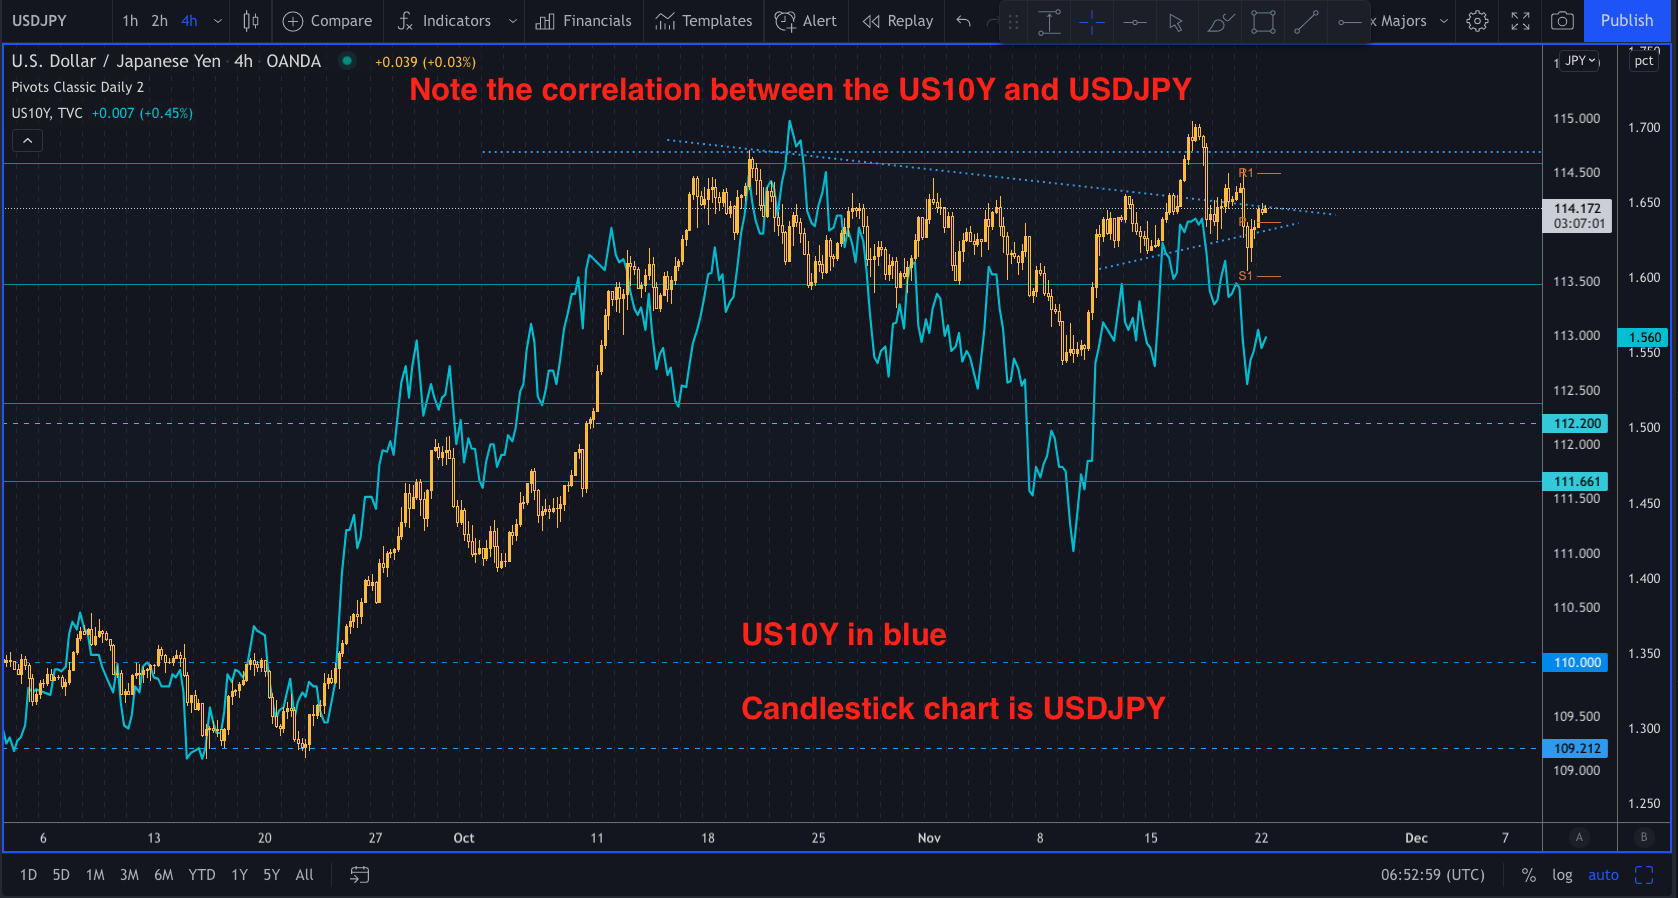 Oil pricesRising oil prices is a negative for the JPY as pricier crude take JPY out of Japan. Japan buys most of its oil from overseas and a weak Yen will make those imports more expensive. If oil starts gaining to the upside watch out as this can weaken the JPY