rss

Japan Core Machinery Orders for December +5.2% m/m (expected -6.1%)

Japan Core Machinery Orders for December

+5.2% for a good beat

  • expected -6.1%, prior +1.5% m/m

+11.8% y/y

  • expected %, prior % y/y

This is better news again for the Japanese economy (the news has been less bad so far this week for the economy … however with the new state of emergency in January the data may well deteriorate again.

The Government has rtasied its assessment on machinery orders in response to this better data.
A caveat with this data point each month is it is highly volatile. Still +11.8% y/y is good news. the data is indicative of capex 6 to 9 months ahead.
After its move above 106 earlier and highs over 106.20 (briefly) USD/JPY is little changed circa 106.10.

Reuters Japan Tankan for February: Manufacturing index +3 (prior -1)

The monthly Reuters Tankan is intended to be a guide to the quarterly BOJ Tankan


  • February manufacturers’ sentiment index +3 vs January -1, first positive since the middle of 2019
  • Manufacturers’ mood positive for 1st time since July 2019
  •  Service-sector index -7 in February vs January -11
The background to this in Japan is improving overseas demand though emergency pandemic measures covering Tokyo and other cities hit domestically.
More:
  • index for manufacturers seen recovering to 8 in May
  • non-manufacturers’ index expected to be flat in May

Singapore Q4 GDP +3.8% q/q and -2.4% y/y

Singapore data, GDP for 2020 as a whole is -5.4% y/y


  • Q4 GDP +3.8% q/q at seasonally adjusted rate
  • Q4 GDP -2.4% y/y (Reuters poll -3.5%)


Singapore’s Ministry of Trade and Industry (MTI) maintains 2021 GDP growth forecast at +4% to +6%


  • says domestic economy to see gradual recovery over 2021; outlook remains uneven across sectors
  • says pace of border re-opening slowed amidst global surge in covid-19 cases and emergence of more contagious strains of virus
  • says manufacturing sector likely to expand at faster pace than previously projected in 2021
  • 2021 total merchandise trade forecast adjusted upwards to +2% to +4%


Following the data release are comments from Singapore’s trade secretary:

  • says the US and Europe should reach population immunity in H2 of this year
  • says there are significant uncertainties due to vaccine supply
Also, an official at the Monetary Authority of Singapore  :
  • monetary policy stance remains unchanged
  • will see a gradual turnaround in the economy this year
  • inflation could rise in Q2, due to base effects
  • full labour market recovery will be gradual

Japan preliminary GDP for Q4 (sa) 3.0% q/q (expected 2.4%)

Japan GDP preliminary for Q4 2020

GDP sa 3.0% q/q

  • expected 2.4%, prior 5.3%

GDP annualised sa 12.7% q/q

  • expected 10.1%, prior 22.9%

GDP nominal 2.5% q/q

  • expected 1.9%, prior 5.5%

GDP deflator (an inflation indication) 0.2%

  • expected 0.5%, prior 1.2%

Private consumption 2.2% q/q

  • expected 2.0% q/q, prior 5.1%

Business spending 4.5% q/q

  • its first rise for 3 quarters and its highest since Q1 of 2015
  • expected 2.4%, prior -2.4%
Q4 was October – December so while these are OK results remember this is an old data point.

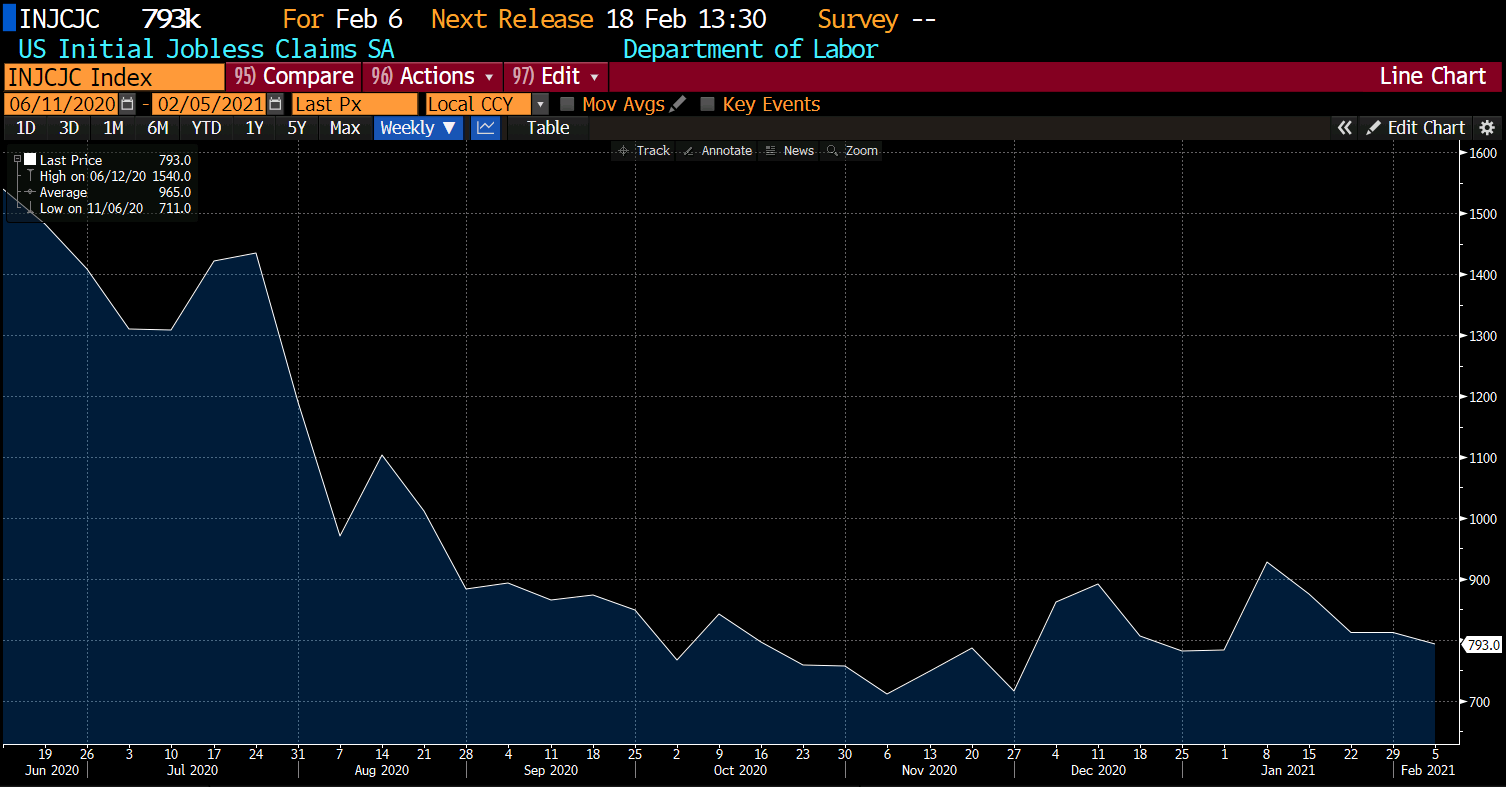
US initial jobless claims 793K vs. 760K estimate

S initial jobless claims and continuing claims for the current week

  • prior week 779K revised to 812K
  • Initial jobless claims 793K vs. 760K estimate
  • 4 week moving average of initial claims 823K vs. 856.5K last week
  • Continuing claims 4545K vs. 4420K estimate. Prior week 4690K vs. 4592K previously reported
  • 4 week moving average of continuing claims 4748.75K vs. 4906.25K (revised)
  • Pandemic unemployment assistance 8,715,306 vs 7,218,801 last week (was 7,217,713). That is a gain of 1,496,505
  • 50 states reported 4,777,842 continuing claims for pandemic emergency unemployment compensation benefits vs. a revised 3,604,894 last week or +1,172,948
  • The largest increases in initial claims for the week ending January 30 were in California (+51,025), New York (+11,140), Florida (+6,322), Rhode Island (+4,684), and Pennsylvania (+3,844),
  • The largest decreases were in Illinois (-55,473), Kansas (-7,496), Mississippi (-3,107), Ohio (-2,181), and New Jersey (-2,156).

The claims and continuing claims were higher than expectations, but lower than the revised higher numbers last week. The claims for initial and continuing pandemic emergency assistance both rose sharply. As expressed by Fed officials, employment is well off full employment levels.

Initial jobless claims
Go to top