Archives of “Economy” category
rssCBO forecast vis actual Treasury yield
People’s Bank of China wary of rising household debt – could damage economic recovery
A PBOC research paper is highlighting that a household credit boom could tend to drag down economic growth more so than corporate debt.
- researchers say household leverage slowed real per-capita GDP growth by 3.7% in five years
- due to indebted houlsegholds reducing consumption
- and that highly-indebted households are vulnerable to negative income changes
- recommend that policy makers strictly control the leverage of households
The rapid increase in household debt in China has been driven by mortgages & a relaxation in lending standards.

Eurozone March final services PMI 49.6 vs 48.8 prelim
Latest data released by Markit – 7 April 2021

- Composite PMI 53.2 vs 52.5 prelim
The preliminary report can be found here. Some modest upside revisions to the final readings as also seen in the earlier French and German reports. The composite reading is the highest since last July as economic activity stabilised towards the end of Q1.
The manufacturing sector continues to take the lead with services activity seen improving slightly amid tighter restrictions. That may yet remain the case in Q2 as the virus situation continues to pose a threat for the time being. Markit notes that:
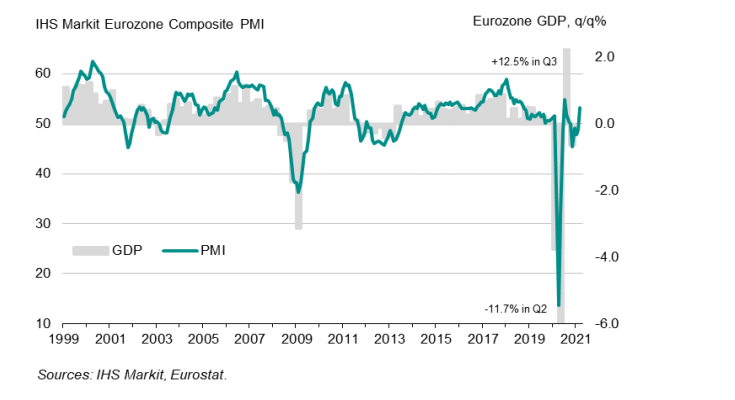
“Eurozone business activity bounced back in March, returning to growth after four months of decline with an even stronger expansion than signaled by the forecast-beating ‘flash’ data.
“Manufacturing is booming, led by surging production in Germany, and the hard-hit service sector has come close to stabilizing as optimism about the outlook improved further during the month. Firms’ expectations of growth are running at the highest for just over three years amid growing hopes that the vaccine roll-out will boost sales in the coming months.
“Strengthening demand has already led to the largest rise in backlogs of uncompleted work seen for almost three years, encouraging increasing numbers of firms to take on additional staff. Improving labour markets trends should help further lift consumer confidence and spending as we head into the second quarter.
“The survey therefore indicates that the economy has weathered recent lockdowns far better than many had expected, thanks to resurgent manufacturing growth and signs that social distancing and mobility restrictions are having far less of an impact on service sector businesses than seen this time last year. This resilience suggests not only that companies and their customers are looking ahead to better times, but have also increasingly adapted to life with the virus.”
IMF boosts 2021 global growth estimate to 6.0% from 5.5% in January
IMF more upbeat on global growth

- 2021 would be strongest year since 1976
- Advanced economies +5.1% vs +4.3% in Jan
- Emerging markets 6.7% vs 6.3% in January
- The IMF sees 4.4% growth in 2022
- Says global economy contracted 3.3% in 2020 vs 3.5% prior estimate
- US GDP seen at 6.4% from 5.1% in Jan estimate on stronger stimulus
- Says that growth depends on vaccine rollout
- Sees multi-speed recovery reflecting vaccine rollout differences, extent of fiscal support and structural factors
Country numbers compared to January estimates:
- US 6.4% vs 5.1%
- Germany 3.6% vs 3.5%
- France 5.8% vs 5.5%
- Japan 3.3% vs 3.1%
- UK 5.3% vs 4.5%
- Canada 5.0% vs 3.6%
- China 8.4% vs 8.1%
- India 12.5% vs 11.5%
The biggest delta in all of those is Canada, which helps to explain why CAD has been the best-performing G10 currency so far this year.
Economy go boom!
Purchasing power of one US dollar in every year from 1635 to 2020. Nice job you did here @federalreserve
US initial jobless claims 719K vs 675K estimate
US initial jobless claims and continuing claims for the current week

- Prior week. Revised lower to 658K
- Initial jobless claims 719K versus 675K estimate
- Initial jobless claims 4 week average 719 versus 729.5 last week. This it is the lowest level since March 14, 2020
- Continuing claims 3794K vs 3750K estimate. Prior week revised to 3840K vs 3870K initial reported
- Continuing claims 4 week average 3978.5K vs 4125.75K last week.
- During the week ending March 13, 50 states reported 7,349,663 continued weekly claims for Pandemic Unemployment Assistance benefits (vs 7,735,491 last week), and 51 states reported 5,515,355 continued claims for Pandemic Emergency Unemployment Compensation benefits (vs 5,551,215 last week).
- The largest increases in initial claims for the week ending March 20 were in Massachusetts (+11,386), Texas (+7,599), Connecticut (+4,170), Maryland (+2,605), and Virginia (+2,035),
- The largest decreases were in Illinois (-55,580), Ohio (-45,808), California (-13,331), New York (-4,251), and Florida (-2,991).
The claims move back above 700K but the four week averages are still trending to the downside. The policymakers at the Fed are likely still concerned about the high levels for the initial claims. The pre-pandemic levels were around 250 – 280K.
UK Q4 final GDP +1.3% vs +1.0% q/q prelim
Latest data released by ONS – 31 March 2021

- GDP -7.3% vs -7.8% y/y prelim
- Private consumption -1.7% vs -0.2% q/q prelim
- Government spending +6.7% vs +6.4% q/q prelim
- Exports +6.1% vs +0.1% q/q prelim
- Imports +11.0% vs +8.9% q/q prelim
- Total business investment +5.9% vs +1.3% q/q prelim
Slight delay in the release by the source. The preliminary report can be found here.
There are quite a number of notable revisions to the report, with consumption seen much weaker than initially estimated while business investment has been revised to being much higher than seen in the preliminary data.
In any case, the slight bump higher reaffirms the resilience in the UK economy despite the November lockdown at the time. Q1 economic conditions are likely to take a hit amid tighter restrictions but the outlook for 2H 2021 looks bright amid the quick vaccine rollout.
China March PMIs: Manufacturing 51.9 (expected 51.2) & Services 56.3 (expected 52.0)
China official PMIs for March show improvement
Manufacturing 51.9
- expected 51.2, prior 50.6
Non-manufacturing 56.3
- expected 52.0, prior 51.4
Composite 55.3
- prior 51.6