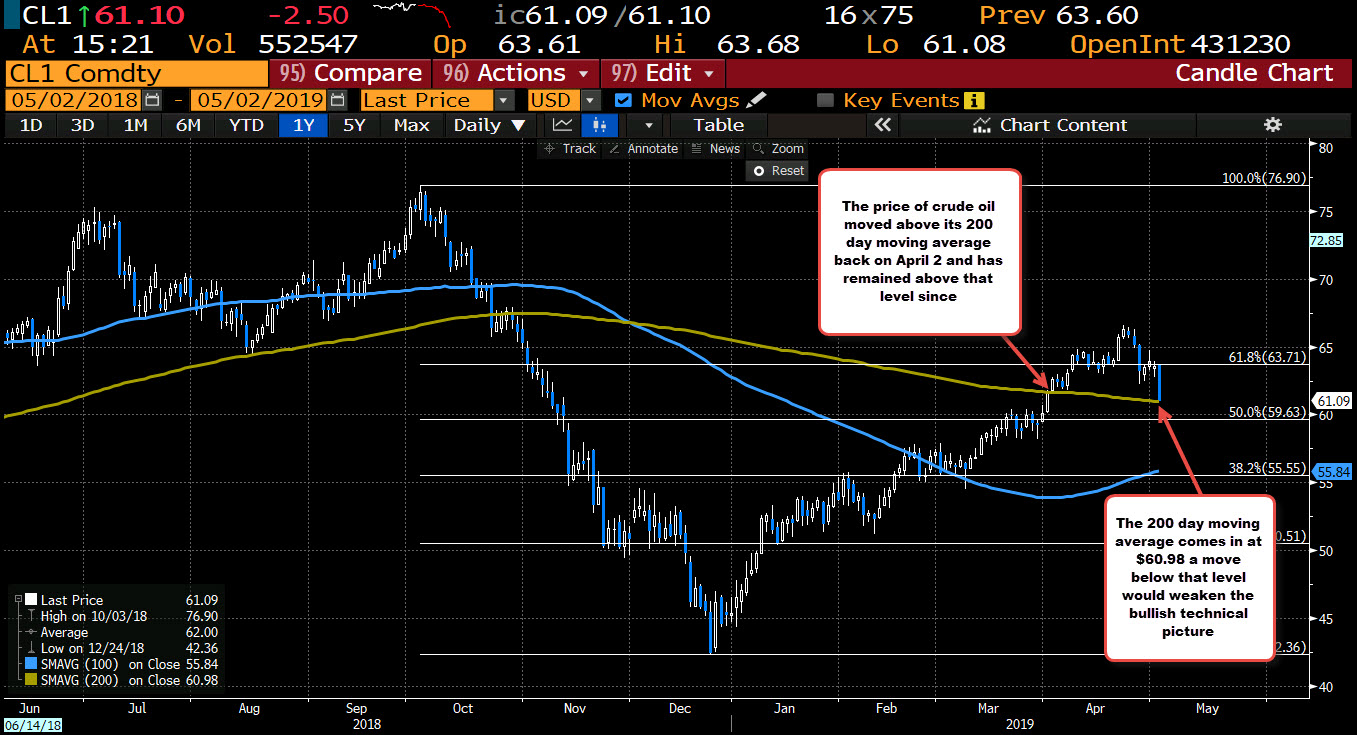
Trading down $-2.52 at $61.08
The price of crude oil futures are trading at session lows at $61.08. That is down $2.52 or -3.92%. Looking at the daily chart below below, the 200 day moving average comes in at $60.98. The price moved above the 200 day moving average back on April 2, and has remained above that moving average since that time. A move below what we can the technical picture for the buyers/bulls.
I would expect buyers on the first test of the key MA, to lean against the level looking for a low risk bounce. However, on a break below, I would look for the buyers to become sellers.
On a break, The 50% midpoint of the move down from the October high would be the next target of $59.63. Below that, if the bearishness continues, traders will be eyeing the 100 day moving average down at $55.84.
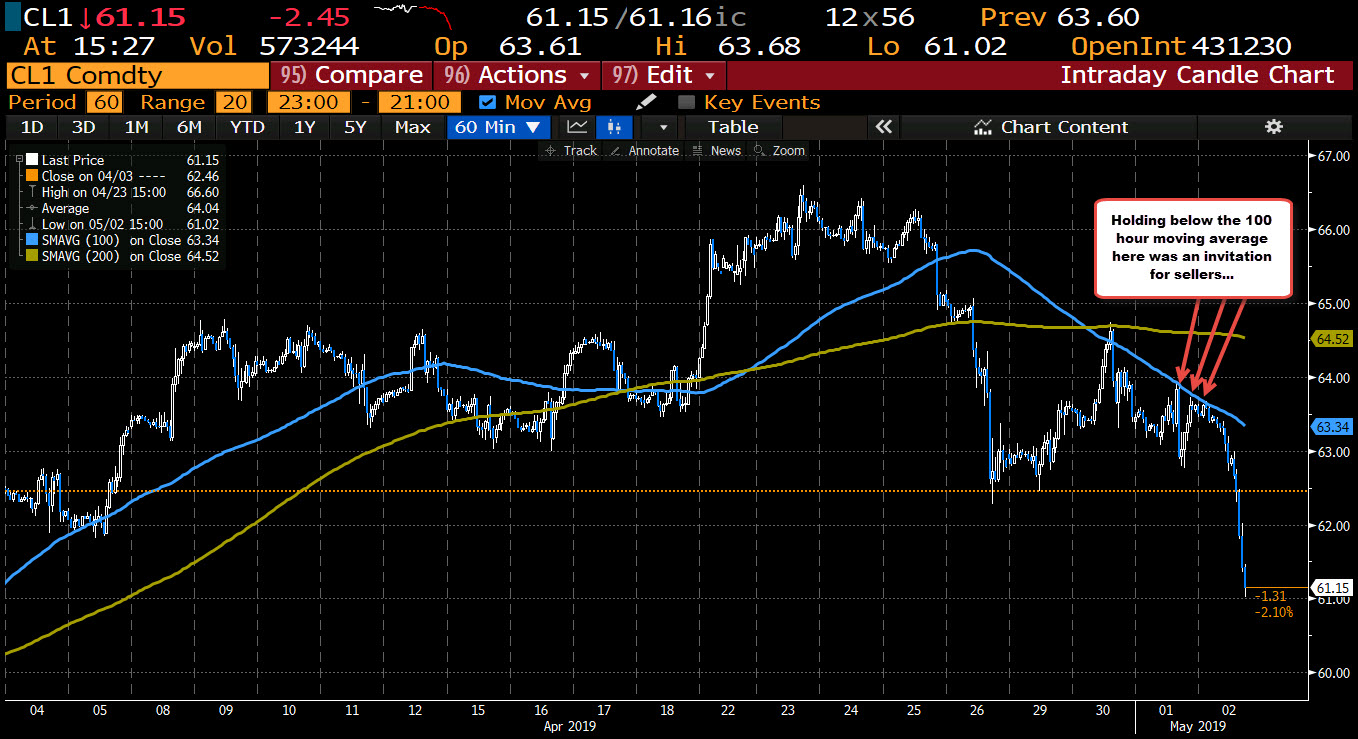
Drilling to the one hour chart, the sellers today (and yesterday leaned against the 100 hour MA (blue line). That was the clue that the sellers were keeping/taking control. The price break down has been accelerating over the last few hours….