rss

Retail traders are getting slaughtered in oil

Retail money continues to pile into the trade

Hedge funds see a chart like this and absolutely lick their chops. It shows shares outstanding in USO, which is the main oil ETF.
Retail money continues to pile into the trade
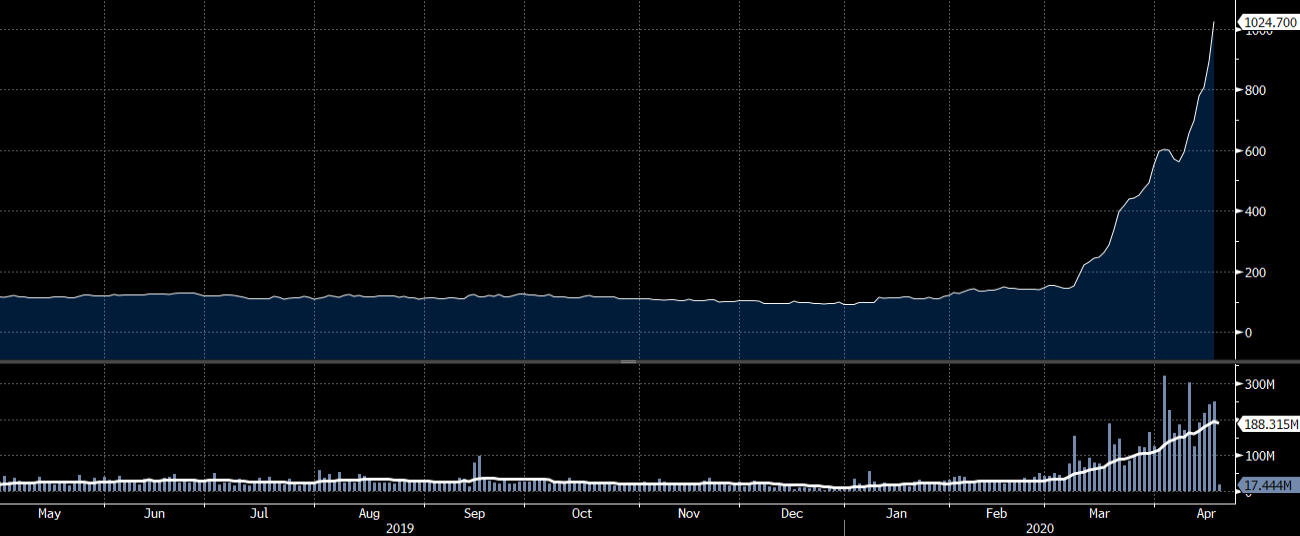
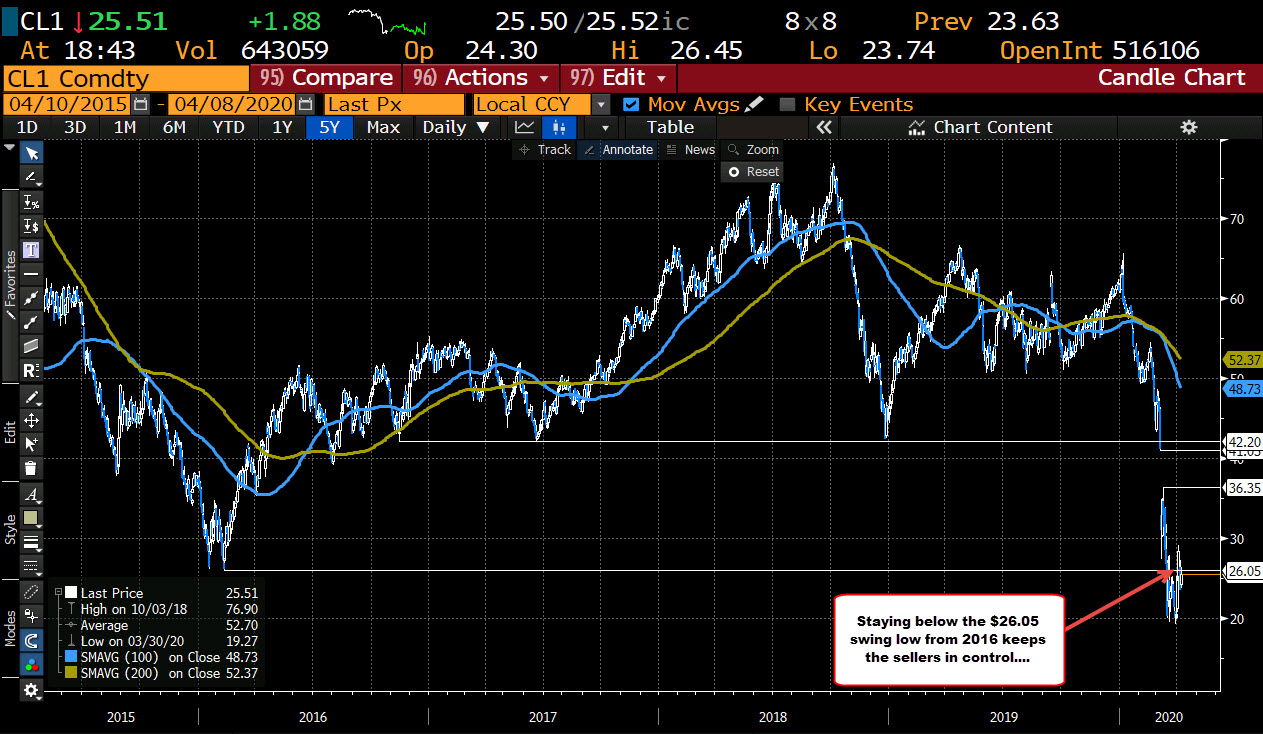
Retail traders have absolutely piled into longs in crude oil, betting on a steeper curve while misunderstanding negative roll yield.
That alone is usually enough for a trade, because of retail’s abysmal track record. What makes it particularly alluring is that the ETF now owns 146,542 contracts for the June expiration. That’s 27.2% of the open interest in the contract, compared to less than 5% normally and they have another few % in pending trades.
Ultimately, these positions need to be sold, not just on the retail side but they will need to be rolled to July. Moreover, the ETF late on Thursday realized that it had a problem and changed its mandate to put 20% of open interest in the second-month contract (which is currently July). They appear to be doing that now and that’s going to place additional pressure on the June contract.

May US oil futures finish down 8% at $18.27

June futures down 50 cents

The volume has rolled into the June contract but we’re going to be watching all of May, June and July closely in the coming days. The May contract expires on April 21 while the US is selling some of it June position to put it in July because it’s 25% of the open interest.
What’s notable about May is that those buyers will have to take delivery. At $18.27 in today’s settlement, there isn’t much appetite for that.
However in June it’s $25.08 and July at $29.43.
There are some unusual things going on in the oil market right now. It’s been quieter this week but that’s not going to last.
Here is a look at the June chart, which has fallen four days in a row:
June futures down 50 cents

OPEC says April oil demand to fall 12 mbpd, Q2 to be -12 mbpd. Risks to the downside

OPEC forecasts

  • Cuts 2020 world oil demand forecast by 6.9 mbpd
  • Says April demand to contract by 20 mbpd
  • Q2 demand to be down by around 12 mbpd
  • 2020 non-OPEC supply is forecast to decline by 1.5 mbpd
  • Downward risks in oil demand forecast remain significant, suggesting possibility of further adjustments
These numbers are fanciful and the comment about downward adjustments is the important one. US gasoline demand as down nearly 50% in the weekly EIA report. WTI is chopping around $20.20.

IEA says there is no feasible agreement that could cut oil supply by enough to offset demand losses

Comments by IEA chief, Fatih Birol

  • April may be seen as the worst month ever
  • We may look back and say that April will be known as ‘Black April’ in the oil market
The risk mood continues to sour further after the IEA report, with oil prices threatening a firm break below the $20 level now.
Price is flirting with a drop below the 30 March low at 19.27 and as mentioned earlier, the drop in oil may be enough to set off a further wave of risk aversion in the market.

Here are the main points so far of the OPEC+ agreement to cut oil output (and the 3 things they missed)

OPEC+ and the G20 have agreed to cut oil production by just under 10 million barrels / day.

Oil trading begins for the week at 2200GMT with Sunday evening trade on CME,
ICYMI … :
  • cut of circa 9.7 million barrels a day of oil across OPEC+ and the G20
  • 13-nation OPEC and others (Russia, US are two) agreed to share cuts
Its unclear how the cuts are to be apportioned, and how the US intends to enforce its promised cuts, but indications are (its is very unclear, but these from sources, awaiting confirmation):
  • Mexico cut 100,000 barrels a day
  • US by 300,000 barrels / day
  • Saudi Arabia’s production to be reduced to 8.5m bpd (from the current whopping 12 million bpd)
When oil trade reopens for the week we’ll see how successful the agreement is, so far, at limiting further price falls for oil.
The important factors that the supply cut does not, is not able, to address is of course is the demand side of the equation. Demand is lower due to:
  • social distancing lock downs of economies
  • the further, recessionary economic impact of these measures (the impacts will linger)
Back to the supply side to finish up, there is a huge overhang of oil in storage.
OPEC+ G20 cut oil production

The final statement from the OPEC+ meeting yesterday

OPEC+
Some key points to take note of from the statement above:
  • Proposal is to cut oil output by 10 mil bpd for 2 months (1 May to 30 June)
  • Subsequently, oil output cut will be 8 mil bpd for 6 months (1 July to 31 December)
  • After, oil output cut will be 6 mil bpd for 16 months (1 January 2021 to 30 April 2020)
  • Baseline for adjustments will be from October 2018 production levels
  • Except for Russia and Saudi, baseline will be from 11.0 mil bpd production level
  • Agreement is conditional on the consent of Mexico
  • Calls upon other major producers to contribute as well

OPEC said to seek as much as 5 mbpd in cuts from G20 nations. Will cut for 2 months

OPEC wants help

The key detail here is how nicely they will ask and what the benchmark will be for others. Is this the US saying that it’s cut 2 mbpd because companies are going bankrupt? Or is it places like Alberta announcing mandatory curtailments?
The other detail that’s crossing is that this will be a two-month cut. That’s not long enough but it’s understandable because no one knows what the world will look like in two months. But if non-OPEC countries are still pumping flat out in 2 months does OPEC drop the hammer on them?
There are huge risks here and we’re not going to get all the answers today.
Here’s the 3-day chart in oil. The 20mbpd talk was the top tick.
OPEC wants help

Crude oil futures settle at $25.09

Up $1.46 vs 6.18%

The price of crude oil futures are settling at $25.09.  That’s up $1.46 or 6.18% on the day.
The high price today reached $26.45, while the low extended to $23.74.
Looking at the daily chart, the settle price was below the swing low going back to 2016 at $26.05. That keeps the sellers more in control from that chart’s perspective.
Up $1.46 vs 6.18%
Zooming in the same daily chart, the rally last Friday moved through the 50% of the range since the gap lower in March at $27.81 but could not reach the 61.8% at $29.83 (the high reached $29.13 on Friday).  The closes this week have all been below the 50% retracement level.
Go to top