rss

Bitcoin rally fueled mostly by crypto enthusiasts, not new money

If crypto can recapture the public’s imagination, it could go to new highs

Where is the money coming from that’s driving the rally in Bitcoin? Prices are up another 13% today to $12,874.
The answer is seemingly tether. That’s the controversial dollar-pegged crypto that’s often used to move money around but is dogged by questions of whether its reserves are truly backed.
Mati Greenspan from eToro highlights that much of the money flowing into Bitcoin in the past day originated in tether. Of the buying into Bitcoin, $4.25 billion started in tether while $1.27B came from USD cash.
If crypto can recapture the public's imagination, it could go to new highs

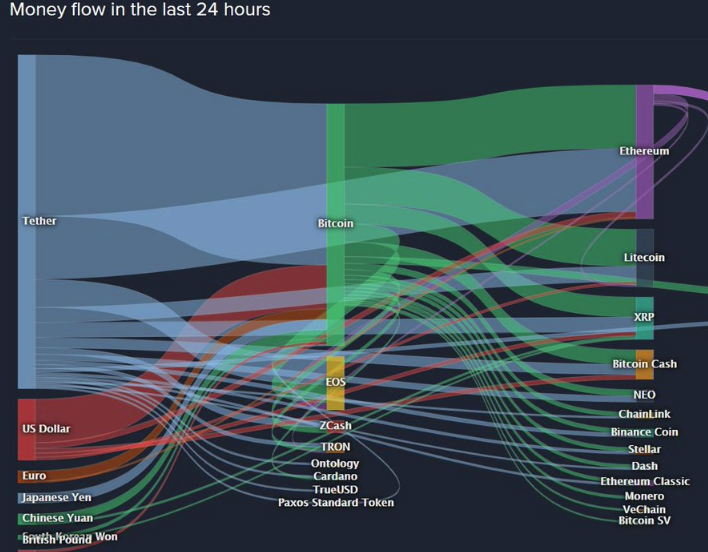
Another interesting tidbit is that even though money is flowing into other cryptos and prices are rising, Bitcoin continues to be the main beneficiary. Bitcoin volumes are higher than nearly all other cryptos combined and its value is over 60% of crypto for the first time since 2017.

Bitcoin price hurtles toward $13,000

The price of bitcoin soared to its highest level since January 2018, as the cryptocurrency’s recent rally shows little signs of fizzling out. 

In Asian trading hours on Wednesday, the price of bitcoin traded on the Bitstamp exchange rose as much as 10 per cent to as high as $12,935.58, putting the digital currency on track for its biggest one-day jump in more than a month. Bitcoin’s price pulled back to just under $12,600 in afternoon trading.

Bitcoin got close to 50% midpoint today

50% of the move down from the December 2017 high

The price of Bitcoin on Coinbase is up about $532 at $11385. The high today reached $11470.20. That got the price within $40 of the 50% midpoint of the move down from the December 2017 high at !9891.99, and the December 2019 low at $3128.89.
50% of the move down from the December 2017 high

Another target comes from the daily chart. The 50% of the big move down from the December 2017 high comes in at $11510.44. Like the 50% on the hourly chart, it too will be key for the longer term picture of bulls and bears.  It is a big line in the sand that buyers will need to break to keep the run higher.  Be aware.

Being a key level, it works as a barometer for buyers and sellers.
For buyers, they want to see the level broken, and the trend higher continuing.
For sellers (may be new longs or profit takers), They want to see the price stall against the level and rotate back down.  If it breaks above, those sellers can cover (and even go long).
So the level remains key. Today the digital currency had it’s closest test but it was still $40 short of the target.
Drilling to the hourly chart below, a lower trend line comes in at $11,110.50 currently.  A move belowt that level might see some selling with the lagging 100 hour MA (blue line) at $10762.02 (and moving higher) as another key level on the downside for sellers/bears. Stay above, and the sellers may win a battle but they are not winning the war.
Bitcoin on the hourly chart remains above the 200 hour MA

Bitcoin eyes $10K. Above the 38.2% of the move down from the all-time high

$10,000 in traders view

The price of bitcoin on Coinbase is currently trading up about $228 at $9789. The high reached $9929. The low extended to $9460.97.  The $10K level is in traders sites.  The price has not traded above the $10,000 level since March 8, 2018 on Coinbase.
$10,000 in traders view
Technically, the price has moved above the 38.2% of the tumble from teh December 2017 high (at $19891.99) to the December 2018 low (at $3128.89).   That level comes in at $9532.39.   That level is the closest risk level on the daily chart for longs now.  This week’s move above that level is good news for the buyers.  Moving back below would not be so great.
The digital currency today, did disappoint by stalling ahead of the May 5, 2018 high at $9948.12. That level is the first upside target before the $10,000 level.
The price of Bitcoin moved first above the $10000 back on November 29, 2017.  The price traded above and below the key level for a few days. On December 2, 2017, the price traded above the level for the day and did not look back until falling below the level on January 17th 2018. In the meantime it raced (and I mean raced) to the all time high.
Drilling down to the hourly chart, the digital currency moved above a topside trend line earlier today AND held corrections down to that broken line. That trend line comes in at $9670 currently.  That level is the closest risk level on that chart. A move below would tilt a little of the bias back down. However, it will take a move back below the 38.2% on the daily at the $9532.39 to hurt the bias more.
Bitcoin on the hourly chart.

Visa, Mastercard, PayPal and Uber all backing Facebook’s new cryptocurrency

Facebook will be launching its digital coin next week

  • A consortium of firms including Visa, Mastercard, PayPal and Uber are chipping ininvesting around $10 million each
WSJ citing ‘people familiar with the matter’ for the info.
The coin will be pegged to a basket of government-issued currencies
Oh, price check on BTC:
Facebook will be launching its digital coin next week

Bitcoin back below $8000. Reached $9090 last week

The digital currency is in the $7450 to $8400 range

The price of bitcoin is trading back below the $8000 level today after a plunge that took the price from around $8500 to $7700 in the first few hours of trading today. Since then, the price is waffling mostly below the natural $8000 level.
The digital currency is in the $7450 to $8400 range
The move today brings the digital currency back into a $7450 to $8400 range.  From May 13 to May 27, the price traded 12 of 14 days in that range (there were two days when the price traded below the $7450 low).  The 100 hour MA is at $8456 and moving lower.  That should be a risk/bias defining level now for the currency.  Move above, and this tumble is just a normal correction.
On the downside, should the price be able to stay below the $8000 level, I would expect buyers near that $7450 low ($7500 sounds like a nice round level to buy against).  By the way, the 38.2% of the move up from the April 26th low comes in at $7513.49.  That increases the areas importance IF there is a dip.
Bulls in Bitcoin, can call these dips as opportunities to load up and also necessary evils if the price is to go higher and higher and higher.  They need the naysayers to get offsides and be forced to cover on the squeezes higher.
Whether it pans out that way or not, I don’t know, but what I do know is if the $7500 area holds, the bulls are still more in control, and a break of the 100 and 200 hour MAs above (blue and green lines) would also be good for the buyers/bulls.  If broken the $9090 high from last week would be on traders radars as the next key upside target.
Go to top