

The Dot Plot for March 2022 shows the median rate at the end of 2022 at 1.9% vs 0.9% in December. That is seven hikes in 2022 which is congruent with the market but above expectations from the Fed.
In 2023 the expectations are for 2.8% vs 1.6% median (and 11 of 18 at 1.9%) in December.. They also see 2.8% in 2024.
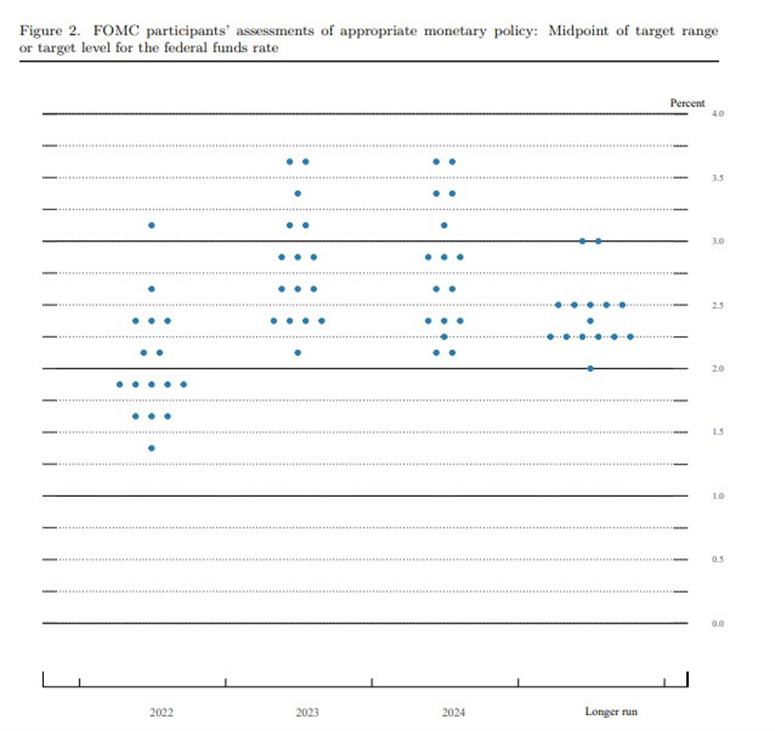
The Dot Plot in December showed:

The table of the central tendencies from March 2022 now shows:
