rss

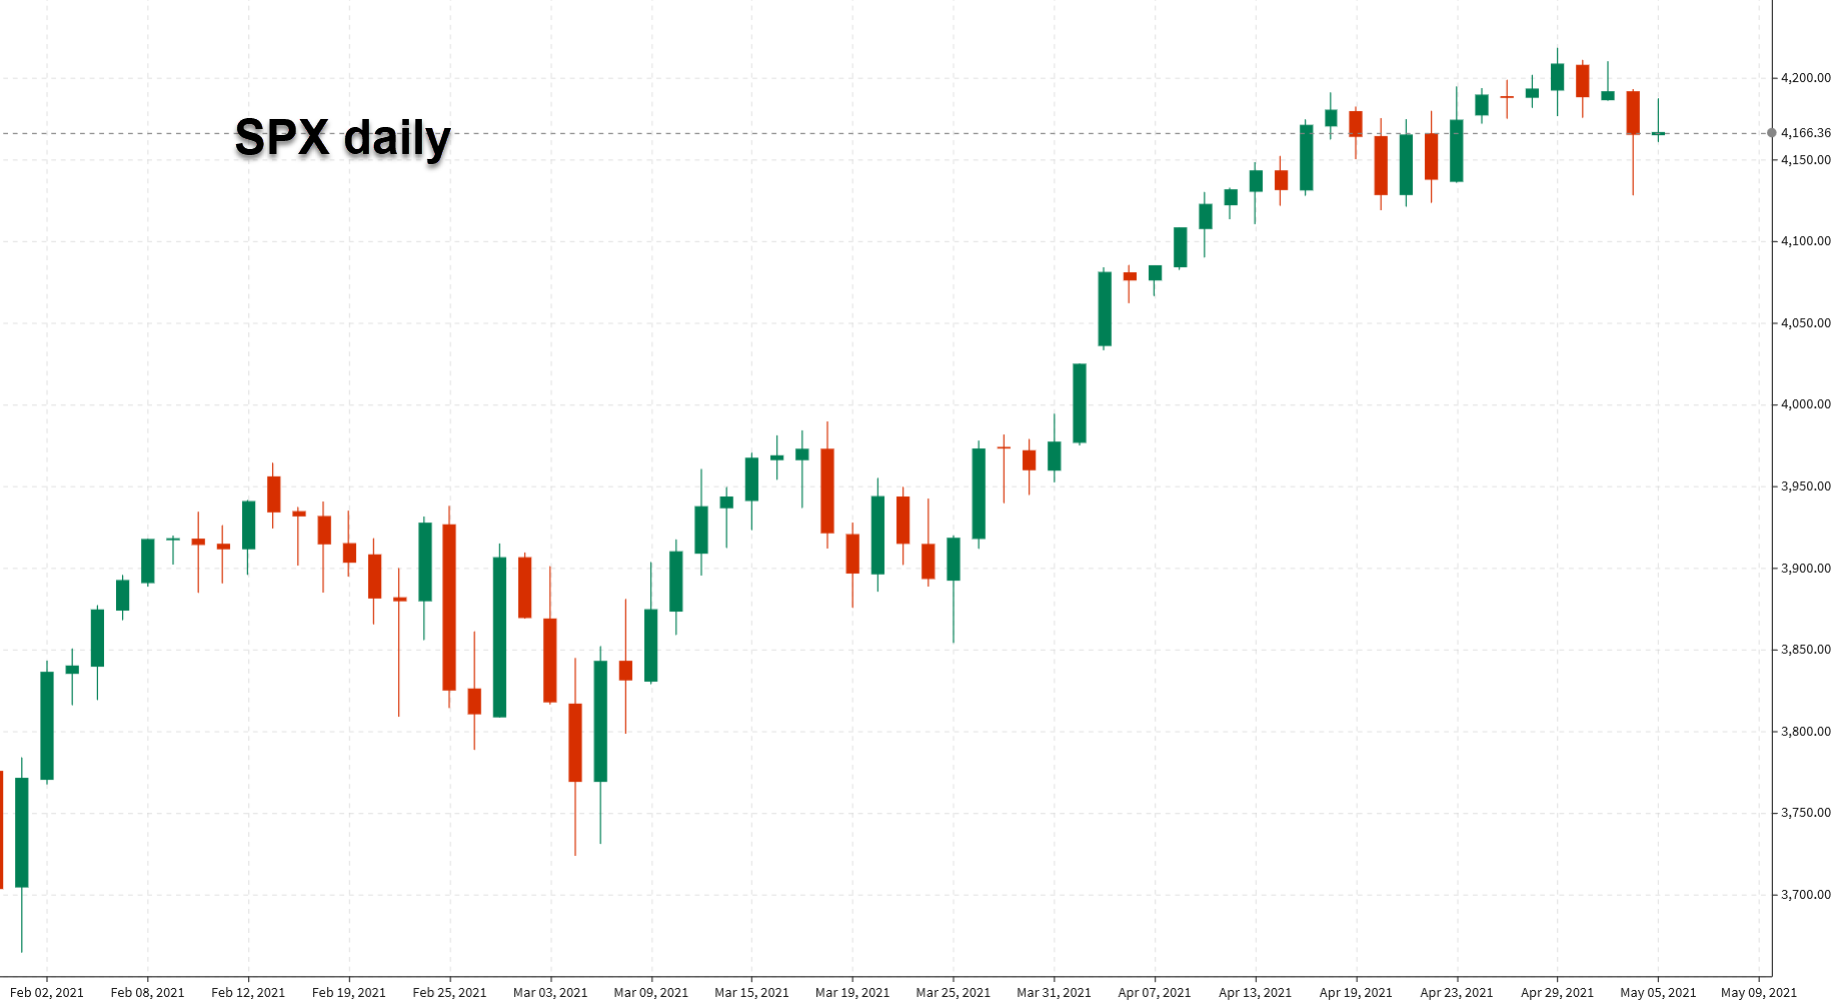
S&P 500 finishes flat after a lively ride, Nasdaq down 0.4%

Up and down but unchanged at the end
SPX chart
Closing changes from the main bourses:
  • S&P 500 +3 points to 4167
  • Nasdaq -0.4%
  • Dow +0.3%
  • Russell 2000 -0.4%
  • Toronto TSX +0.6%
There were some twists and turns on the journey to nowhere. The index started 20 points higher then gave it all back and more. Then hit a session high a noon and chopped along around there before falling again in the last hour to finish unchanged.

USDCAD falls below floor. Tests 2018 low.

2018 low is at 1.22455

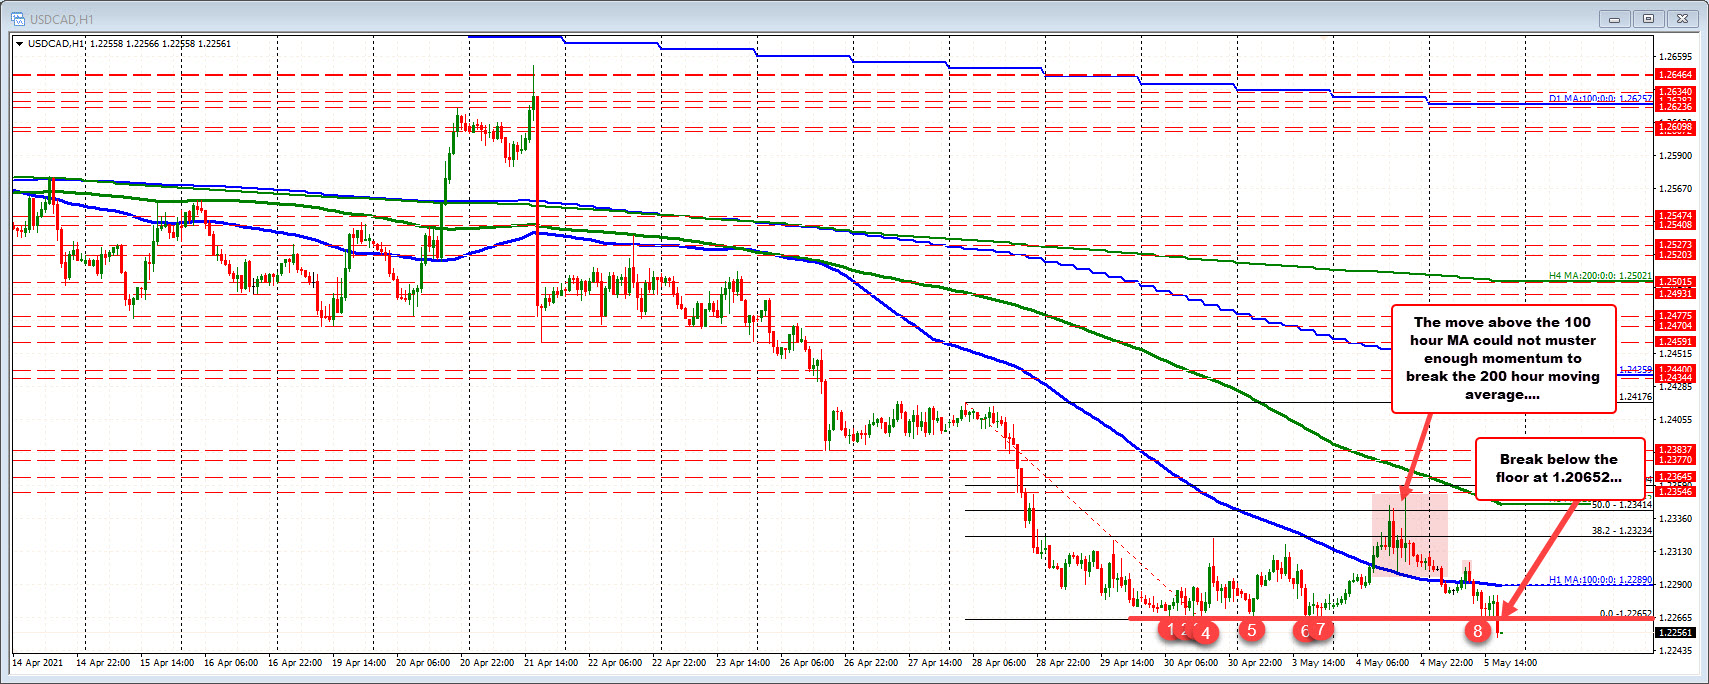
The USDCAD has fallen below a floor from recent lows on Friday, Monday and again today (see red numbered circles in the hourly chart below). That floor was at 1.22652.
The break has seen the price move down to a new 2021 low of 1.22527 (so far).  Stay below the old floor keeps the sellers firmly in control.
If the price is able to get back above the floor, the buyers would still need to still move the price back above its 100 hour moving average at 1.22895.  That moving average was broken yesterday, and again earlier today (after a dip below). The high price yesterday stalled well ahead of the falling 200 hour moving average (green line), and ran out of upside steam.

2018 low is at 1.22455_

If the price can remain below the old floor and falling 100 hour moving average, what next for the pair?

Taking a broader look at the weekly chart, although the price fell below a key floor on the hourly chart, it is also approaching another key level at the 2018 low price of 1.22455.  So  there is another key target to get to and through.  There is more work to do for the sellers.
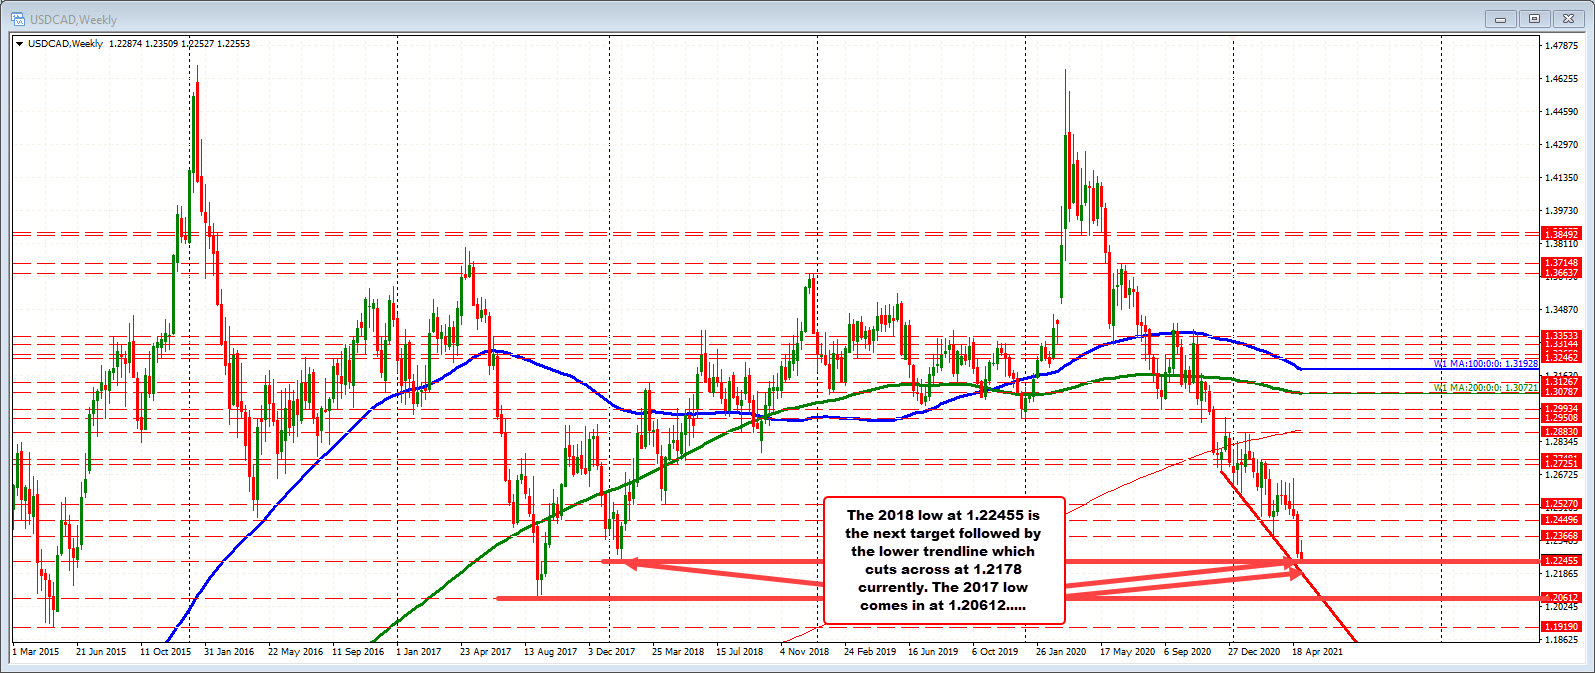
Nevertheless, if that level can be broken, headlines will read and that the USDCAD is now trading at the lowest level since September 2017. Bearish.
The next target would then be a lower trendline that cuts across at 1.2178 on the weekly chart. Move below that level, and  the 2017 low would be eyed at 1.20612.
Sellers remain in firm control below the hourly floor at 1.22652. However, getting below the 2018 low at 1.22455 is still a key target to get to and through if the sellers are to continue to run to the downside for the USDCAD.
USDCAD on the weekly chart

US birthrate declined for the sixth straight year in 2020

In the long term, demographics are everything

In the long term, demographics are everything
The great long-term problem that’s facing nearly every global market is demographic — people are having fewer babies.
Fewer babies means fewer consumers and that’s a major deflationary force. The developed world can supplement that with immigration but the birth rate in the developing world is also falling sharply.
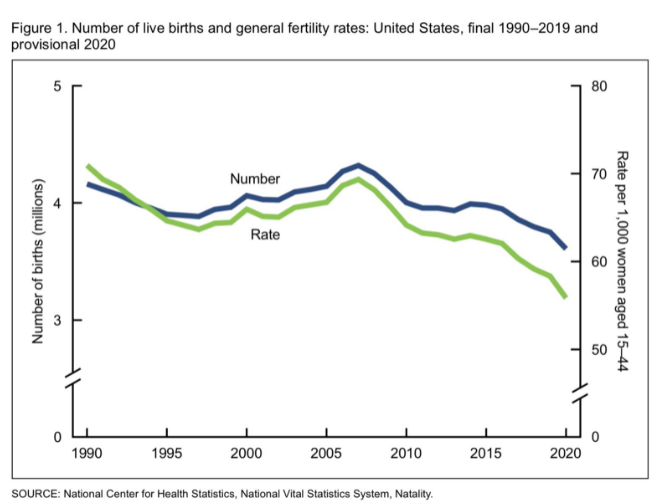
In 2020, the US birthrate fell to 1.64 births per woman, well below the 2.1 replacement rate and down 4% year-over-year. It’s important to note that the pandemic would have had little effect on the number because almost all babies born in the year would have been in utero before March 2020. However there is early evidence that 2021 will be another decline because December births were down 8% year over year. That’s when babies conceived at the start of the pandemic would have been born. I suspect some of that will reverse coming out of the covid-19 but the longer-term trend is inarguable.
On a gross basis, there were 3,605,201 births in the United States last year, the lowest number since 1979.
Due to the pandemic, the US also had higher deaths in 2021 and 25 states had more deaths than births.
Maybe the most-shocking statistic in the report is that the average age of women at first birth is 27, up from 23 just ten years ago. That’s come with a collapse in teen pregnancy.
Meanwhile, other countries are far worse than the US. In South Korea, the fertility rate is under 1.

EURUSD trades back down toward low for the day

Tests a swing area between 1.1987 and 1.19943

The price of the EURUSD as seen down and up and back down action in trading today. The low to high trading range is only 41 pips. The 20 dude day average is 62 pips. There is room to roam.
Tests a swing area between 1.1987 and 1.19943_
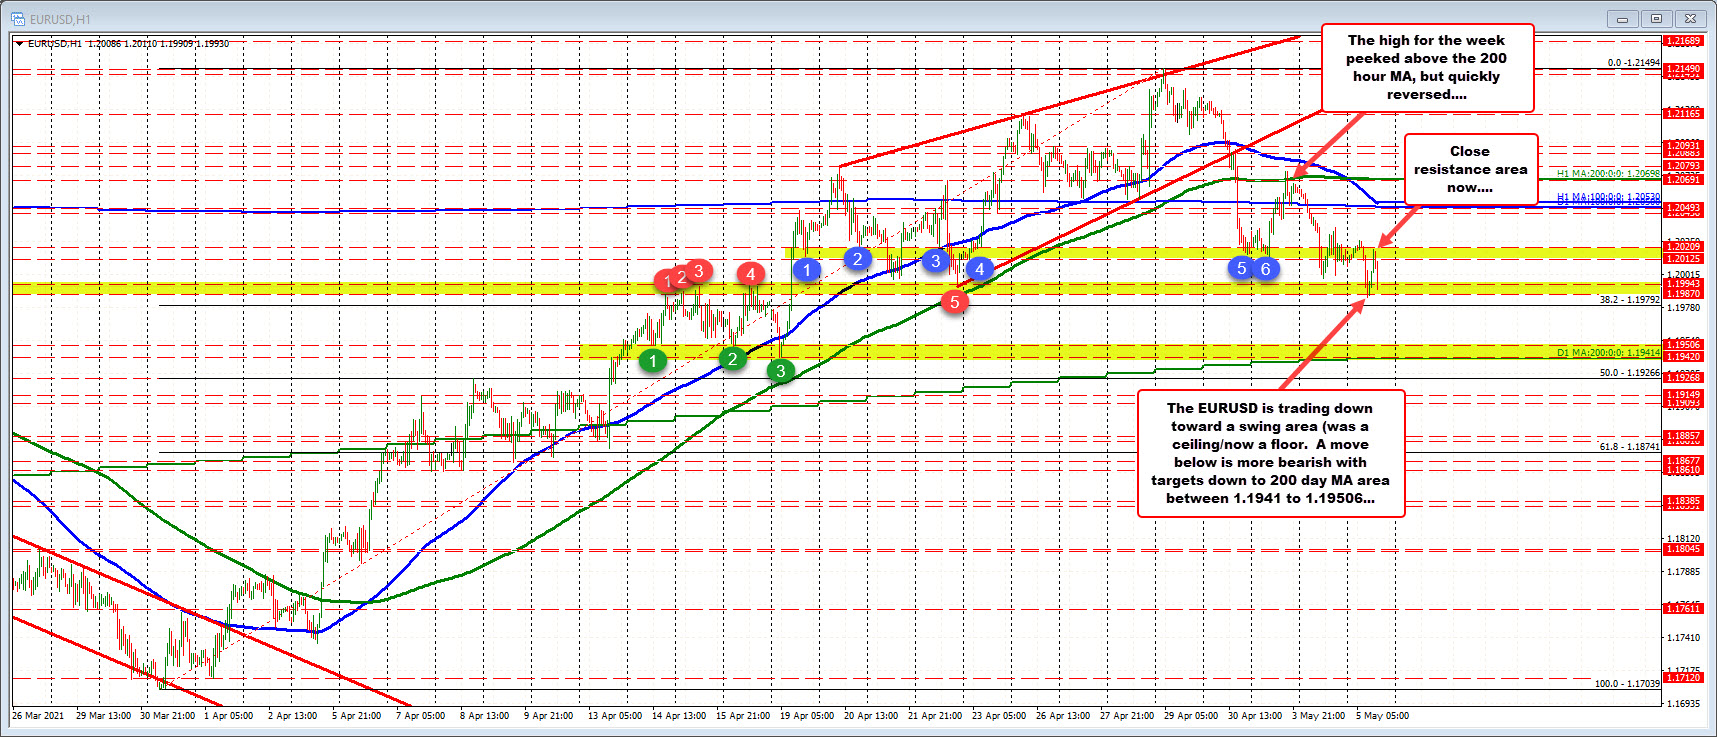
The current price is trading around 1.1995. The 1.1987 to 1.19943 area is a swing area which was a ceiling going back to April 14 until it broke higher on April 19.  The old ceiling was retested on April 22, and held support (see red numbered circle 5).  The lows today have been retesting that area and finding some cause for pause.  A move below, and then below the 38.2% retracement of the move up from March 31 low at 1.19792, would have traders targeting the 200 day moving average and a lower swing area (see green numbered circles) between 1.19414 and 1.19506.
What would hurt the bearish bias?
  • Not being able to get below 1.1987, and/or
  • moving back above a swing area between 1.20125 and 1.20209 (see blue numbered circles in the chart above).
The EURUSD trended higher from the March 31 low to the hi reached on April 29. Three of the last four trading days have been to the downside (today the price is lower as well).  On Monday, the pair retested its 200 hour moving average – peeking above the level briefly before rotating back to the downside.  Yesterday, the price moved back below its 100 day moving average at 1.2050 currently and ran further away from that key moving average level.
The move higher in April took bullish steps along the way, that become target steps on the way down as well (yellow areas).

Oil continues stellar advance this week, eyes March highs

WTI up 1.3% on the day to $66.50 currently

WTI D1 05-05

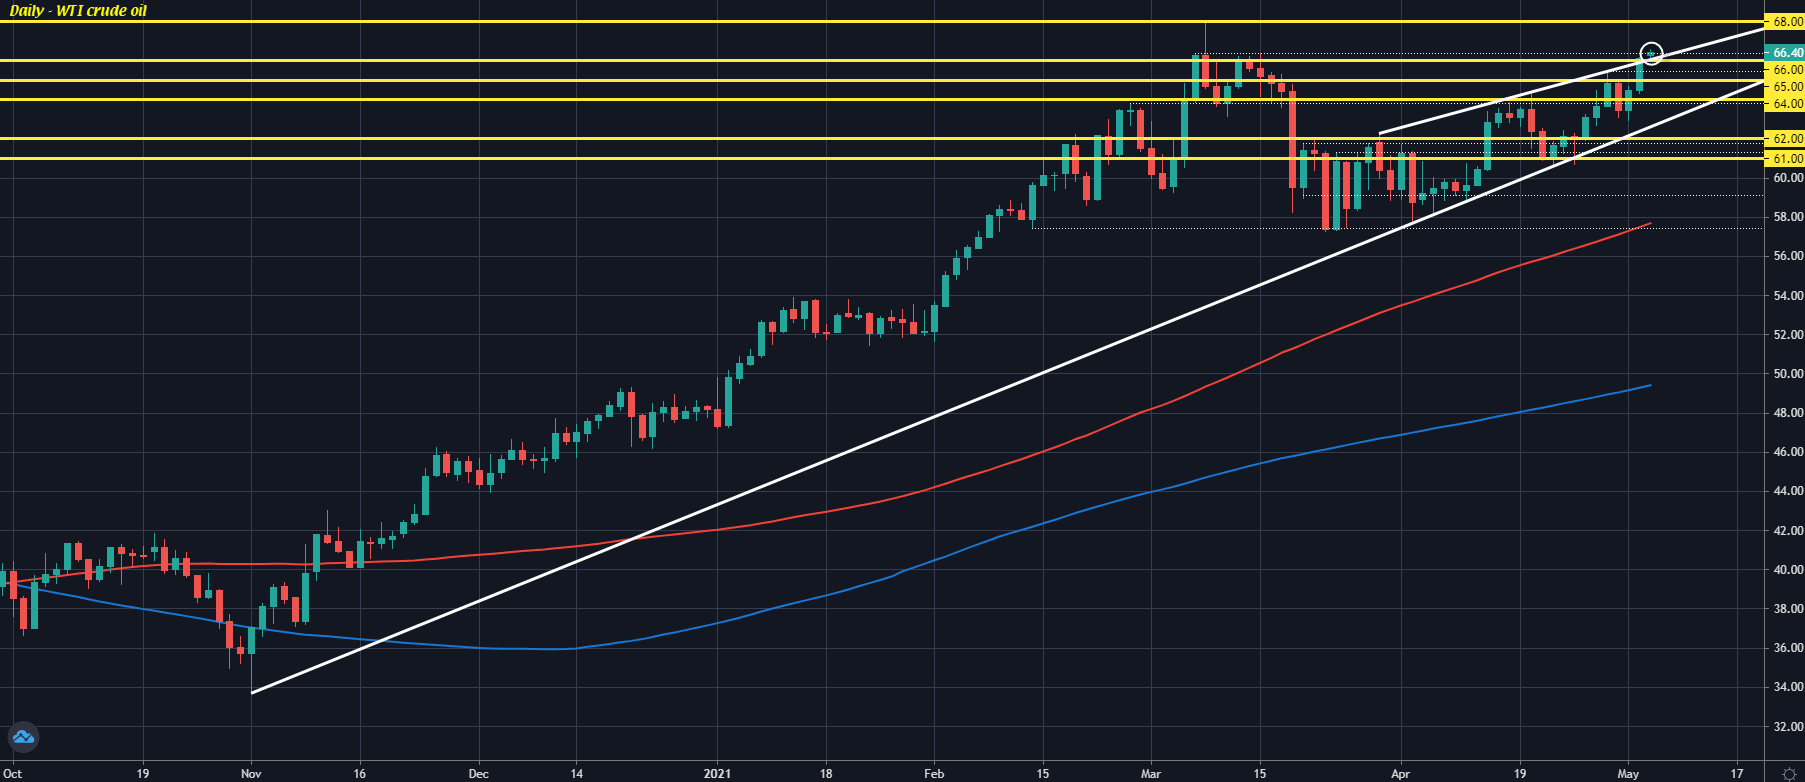
Buyers continue to ride the uptrend in oil and this reaffirms the more bullish sentiment in the commodity, as price now eyes the March highs with Brent also closing in on $70.
WTI is up 1.3% to $66.50 and treading water above daily resistance at $66.37 with the March high @ $67.94 one to keep an eye out for as the topside run extends.
The April 2019 high @ $66.58 is also one to watch on the daily as oil buyers look to contest an extended breakout after having consolidated since mid-March.

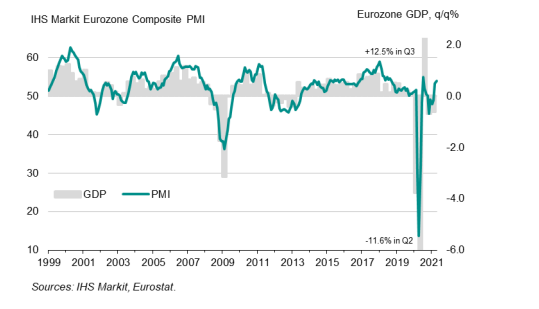
Eurozone April final services PMI 50.5 vs 50.3 prelim

Latest data released by Markit – 5 May 2021

  • Composite PMI 53.8 vs 53.7 prelim
The preliminary report can be found here. The final readings reaffirm some modest resilience in the euro area economy, with the services sector returning to growth after seven months of contraction beforehand.
There were solid performances in Spain and France to add to Germany’s robustness since Q1, which is largely aided by its manufacturing sector.
This does add some optimism going into 2H 2021 if vaccinations gather pace and the virus situation is kept under control, paving the way for a summer reopening perhaps.
Markit notes that:


“April’s survey data provide encouraging evidence that the eurozone will pull out of its double-dip recession in the second quarter. A manufacturing boom, fueled by surging demand both in domestic and export markets as many economies emerge from lockdowns, is being accompanied by signs that the service sector has now also returned to growth.

“Barring any further wave of infections from new variants, Covid restrictions should ease further in the coming months, driving a strengthening of service sector business activity which should gain momentum as we go through the summer.

“The intensity of the rebound will naturally depend on the extent to which Covid restrictions can be removed – and some measures relating to international travel are likely to remain in place for some time to come – but experience in other countries hints that the bounce in domestic activity could be strong as pent up demand and savings power a surge in spending.

“While the revival in the economy is bringing a rise in inflationary pressures, these so far seem largely confined to the manufacturing sector, with service sector costs – which form a major component of the core inflation measures tracked by the ECB – remaining only modest.”

Go to top