

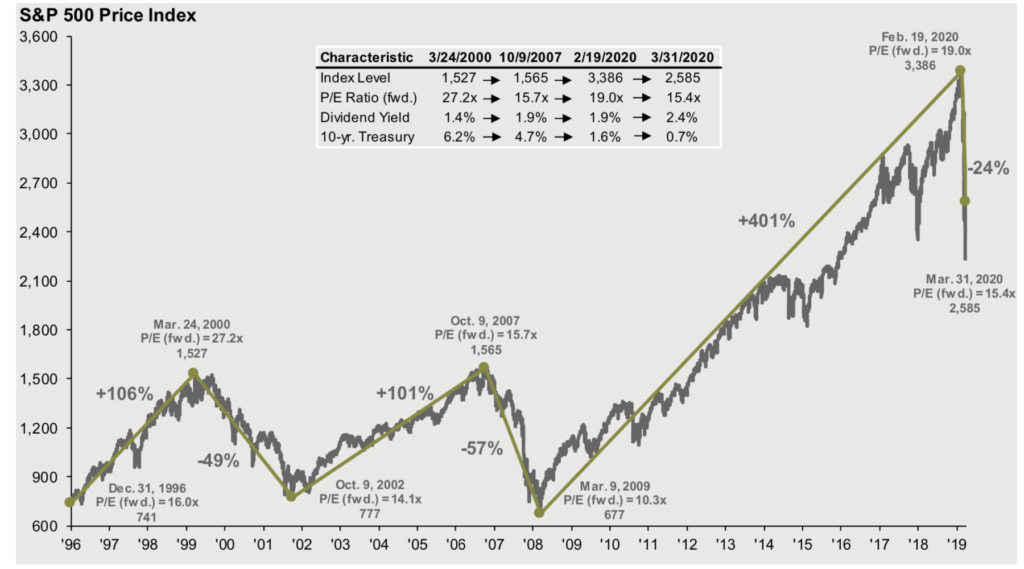
I have been showing various graphs from the Big Book of Charts – or as it is formally known, JP Morgan’s quarterly interactive “Guide to the Markets” —
But that chart above? Man, I don’t ever recall seeing anything remotely like that in US, Even 2008-09 took 18 months to progress.